Download
1 / 23
230 likes | 240 Vues
Polynomials and Rational Functions (2.1). The shape of the graph of a polynomial function is related to the degree of the polynomial. Shapes of Polynomials. Look at the shape of the odd degree polynomials. Graph of Odd polynomial. Graph of Odd Polynomial. Graphs of even degree polynomials.

E N D
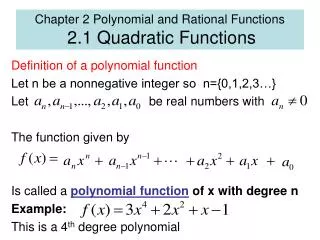
Polynomials and Rational Functions (2.1) The shape of the graph of a polynomial function is related to the degree of the polynomial
Shapes of Polynomials • Look at the shape of the odd degree polynomials
Graphs of even degree polynomials • Now, look at the shape of the even degree polynomial
Graph of even degree polynomial • Here is another example of an even degree polynomial :
Generalization: • The graphs of odd-degree polynomials start negative, end positive and cross the x-axis at least once. • The even-degree polynomial graphs start positive, end positive, and may not cross the x axis at all
Characteristics of polynomials: • Graphs of polynomials are continuous. One can sketch the graph without lifting up the pencil. • 2. Graphs of polynomials have no sharp corners. • 3. Graphs of polynomials usually have turning points, which is a point that separates an increasing portion of the graph from a decreasing portion.
Turning points and x intercepts • Theorem 1 : Turning points and x Intercepts of Polynomials • The graph of a polynomial function of positive degree n can have at most n-1turning points and can cross the x axis at most n times.
Largest value of the roots of a polynomial • Theorem 2: Maximum value of an x-intercept of a polynomial. If r is a zero of the polynomial P(x) this means that P(r) = 0. For example, • is a second degree polynomial . and • , so r = 4 is a zero of the polynomial as well as being an x-intercept of the graph of p(x).
Cauchy’s Theorem • A theorem by a French mathematician named Cauchy allows one to determine the maximum value of a zero of a polynomial (maximum value of the x-intercept). • Let’s take an example: the polynomial
Cauchy’s Theorem • According to this theorem • The numbers within the absolute value symbols are the coefficients of the polynomial p(x). < 1 + maximum value of = 1 + 4 = 5
Result of application of Cauchy’s theorem • From this result we have , which means -5 < r < 5 . This tells us that we should look for any potential x intercepts within the range of -5 and 5 on the x –axis. In other words, no intercepts (roots) will be found that are greater than 5 nor less than -5.
Conclusion , we find that the other zero is located at (0,0). Thus, the two zeros , 0 , -4, are within the range of -5 to 5 on the x-axis. Now, let’s try another example: • From the graph of
An Example: • Example: Approximate the real zeros of • First step: Coefficient of cubic term must equal one, so divide each term by three to get a new polynomial Q(x)= Roots of new polynomial are the same as the roots of P(x).
Example, continued • Step 2: Use the theorem:
Example, continued • Step3: We know that all possible x intercepts (roots) are found along the x-axis between -5 and 5. So we set our viewing rectangle on our calculator to this window and graph the polynomial function. • Step 4. Use the zero command on our calculator to determine that the root is approximately -3.19 (there is only one root).
Rational Functions • Definition: Rational function: a quotient of two polynomials, P(x) and Q(x), is a rational function for all x such that Q(x) is not equal to zero. Example: Let P(x) = x + 5 and Q(x) = x – 2 then R(x)= is a rational function that is defined for all real values of x with the exception of 2 (Why?)
Domain of rational functions • Domain : • and x is a real number. This is read as “the set of all numbers, x , such that x is not equal to 2. • X intercepts of a rational function: To determine the x-intercepts of the graph of any function, we find the values of x for which y = 0 . In our case y = 0 implies that 0 = • This implies that x + 5 = 0 or x = -5 .
Y-intercept of a rational function • Y intercept: The y intercept of a function is the value of y for which x = 0 . Setting x = 0 in the equation we have y = , or -5/2. So, the y-intercept is located at ( 0, -2.5). Notice that the y-intercept is a point described by an ordered pair, not just a single number. Also, remember that a function can have only one y intercept but more than one x-intercept • ( Why?)
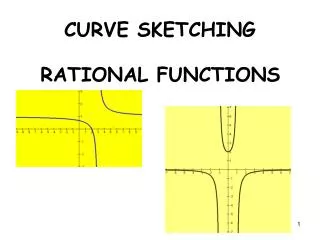
Graph of a Rational function: • Plot points near the value at which the function is undefined. In our case, that would be near x = 2. Plot values such as 1.5, 1.7. 1.9 and 2.1, 2.3, 2.5. Use your calculator to evaluate function values and make a table. • Determine what happens to the graph of f(x) if x increases or decreases without bound. That is, for x approaching positive infinity or x approaching negative infinity. • Sketch a graph of a function through these points. 4. Confirm the results using a calculator and a proper viewing rectangle.
Conclusions: • From the graph we see that there is a vertical asymptote at x = 2 because the graph approaches extremely large numbers as x approaches 2 from either side. • We also see that y = 0 is a horizontal asymptote of the function since y tends to go to zero as x tends to either a very large positive number or very small negative number.