Download
1 / 13
130 likes | 270 Vues
Search for new Luminous Blue Variables (1) (Kniazev: 2011-3-RSA_OTH-002 + 2013-1-RSA_OTH-014 ). Vasilii Gvaramadze (SAI MSU) & Alexei Kniazev. Search for new Luminous Blue Variables (2). Altogether 35 different candidates were observed with different quality.

E N D
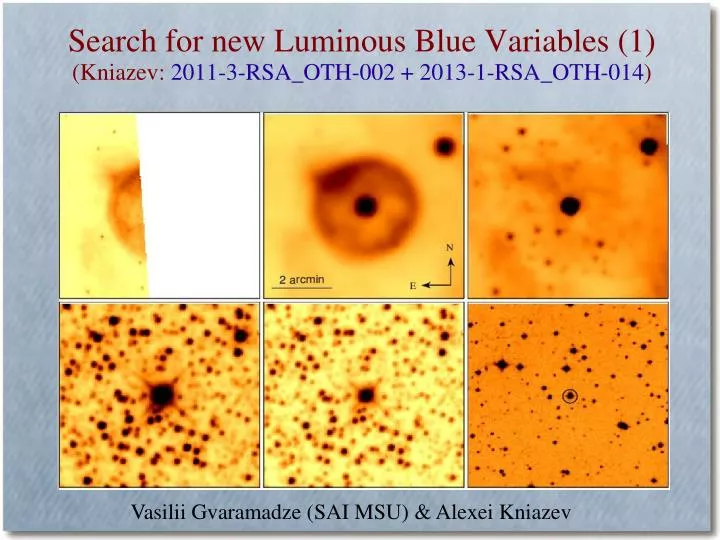
Search for new Luminous Blue Variables (1) (Kniazev: 2011-3-RSA_OTH-002 + 2013-1-RSA_OTH-014) Vasilii Gvaramadze (SAI MSU) & Alexei Kniazev
Search for new Luminous Blue Variables (2) Altogether 35 different candidates were observed with different quality
Search for new Luminous Blue Variables (3) Gvaramadze, Kniazev et al. 2012,MNRAS,421,3325 Comparison of normalised blue spectra of WS1 and WS2 with those of the prototype LBV P Cygni and cLBV MN112. The principal lines and most prominent DIBs are identified.
Search for new Luminous Blue Variables (4) Todt , Kniazev, et al., 2013, MNRAS, 430, 2302 : In this work we reported the spectroscopic identification of another rare [WN] star, the CS of Abell 48. One-dimensional reduced spectra of the central star of Abell 48 (top) and nebula (bottom). The total exposure time is 3x900s. Most of the detected strong emission lines of the nebula are marked.
Search for new Luminous Blue Variables (5) Ha intensity and radial velocity distribution along the slit. Upper panel: DSS-II red band image of Abell 48 with the position of the 1.25 arcsec slit shown by dashed lines. Middle panel: The relative flux of the Ha-line along the slit after continuum subtraction. N-S direction of the slit is shown. The vertical line at r=0 corresponds to the position of the CS. The region r+/-2 arcsec is shown with vertical, dashed lines to mark the area, where the average velocity V_hel = 50.4 +/- 4.2 km/s was calculated. Bottom panel: The velocity profile of the Ha line, corrected by using the night-sky line [OI] 6363 Å. The horizontal line indicates the calculated Velocity 50.4 km/s, that has to be close to the heliocentric velocity of the CS.
The PNe in the area of CMa dwarf galaxy (1) (Kniazev: 2011-3-RSA-003+2012-2-RSA-001)
The PNe in the area of CMa dwarf galaxy (2) From the total sample of 39 PNe and PNe candidates, 28 were observed up to now using SALT and 1.9m SAAO telescopes.
The PNe in the area of CMa dwarf galaxy (3) From the total sample of 39 PNe and PNe candidates, 28 were observed up to now using SALT and 1.9m SAAO telescopes.
The PNe in the area of CMa dwarf galaxy (4) Pilot results on observations of first 7 PNe are published in Kniazev 2012, Astronomy Letters, 38, 707: α-element/oxygen abundance ratios log(Ne/O), log(S/O), and log(Cl/O) for HII regions versus oxygen abundance. The large filled circles represent the calculated abundance ratios for some of the PNe. The measured ratios for PNe from this paper are indicated by the open squares together with their ±1σ errors. .
The PNe in the area of CMa dwarf galaxy (5) The comparison of velocities taken from SALT data (grating GR900) and from other sources. SALT data show very nice accuracy.
The Eridanus void galaxies: census and evolutionary status (1)(Kniazev: 2012-1-RSA-001+2012-2-RSA_OTH-004) • Role of denser galaxy density is relatively clear, but for very low density regions (voids) the effect of environment is poorly known. • Voidsare delineated byluminous (L > L*) massive objects, are populatedby dwarfs and devoid of luminous objects. Void properties can vary. • Not only galaxy interactionsoccur in voids much less frequently, but also DM halo and galaxy formation from density perturbations can be somewhat retarded due to the lower voidmean gravitational potential.
The Eridanus void galaxies: census and evolutionary status (2) Six galaxies in the Eridanus void out of 7 observed in 2012-1 And 2012-2 show [O III] 4363 line.
The Eridanus void galaxies: census and evolutionary status (3) • The basic relation “O/H vs M_B” as derived on the Local Volume groups and field dwarfs (van Zee & Haynes 2006, the upper dashed line) and O/H, observed in void dwarfs • The line shifted by 1 mag (or ~0.15 dex on O/H) better accounts for possible systematic lower O/H in the void • Black points are our data from Pustilnik, Teplyakova & Kniazev (2011) for galaxies from Lynx-Cancer void. Red points are our data from SALT and SDSS for the Eridanus void galaxies