Download

1 / 67
670 likes | 780 Vues
My mousetrap car Inquiry Project. by Jocelyn Wells. Starting Questions. What should I use for wheels and axles? How long should the lever arm be? Should I try to make the car as light as possible? What could I do to increase traction?

E N D
My mousetrap car Inquiry Project by Jocelyn Wells
Starting Questions • What should I use for wheels and axles? • How long should the lever arm be? • Should I try to make the car as light as possible? • What could I do to increase traction? • Would it be better to build a car for distance or for speed?
Goal • to build a mousetrap car that could travel 5m with the greatest average velocity possible
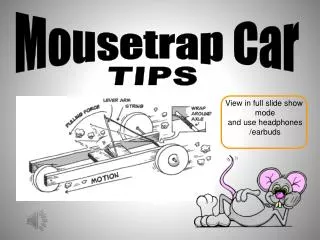
Initial tips from research • Use small wheels and a large axle so that the wheel to axle ratio is small • Maximize the string to axle traction • Build a lighter car for best speed as inertia will be smaller • Try to have energy released quickly with a shorter lever arm to travel a short distance quickly • Minimize friction by minimizing contact surface area
Position-time graphs for first set of trials with a lever arm of 8cm Trial 1 Trial 2
Position-time graphs Trial 3 Watch the video here!
Trial 4 Trial 4 Position-time graph Watch the video here!
Position-time graphs • The average velocity decreased when the paper was added, but it was necessary for the motion sensor to keep track of the car. Trial 5
Rubber gloves for extra traction Trial 6
Position-time graphs Trial 7 Trial 8
Aha! The left wheels were slipping on the axles. Trial 9 Trial 10
Position-time graphs Trial 11 Trial 12
Trial 13 Position-time graph Average velocity = 1.72m/s
Trials 10 to 13 • The average velocity for trials 10 through 13 with a lever arm of 8cm was: • Trial 10=1.795m/s • Trial 11=1.690m/s • Trial 12=1.818m/s • Trial 13=1.723m/s Average= 1.75m/s +/-0.06
Trial 14 Position-time graph Larger axle diameter
Trial 15 with 6.5cm lever arm Position-time graph
Trial 16 with 6.5cm lever arm Position-time graph
Trial 17 with 6.5cm lever arm Position-time graph
Trial 18 with 6.5cm lever arm Position-time graph
Trial 19 with 6.5cm lever arm Position-time graph
Trial 20 with 6.5cm lever arm Position-time graph
Trials 15 to 20 • The average velocity for trials 15 to 20 with a lever arm of 6.5cm was: • Trial 15=1.778m/s • Trial 16=1.71m/s • Trial 17=1.728m/s • Trial 18=1.744m/s • Trial 19=1.683m/s • Trial 20=1.722m/s Average= 1.73m/s +/-0.05
Trial 21 with 5cm lever arm Position-time graph
Trial 22 with 5cm lever arm Position-time graph
Trials 20 and 21 • The average velocity for trials 21 and 22 with a lever arm of 5cm was: • Trial 21=1.622m/s • Trial 22=1.466m/s Average=1.54m/s +/-0.07
Reflection on Car A • 5E Learning Cycle • Explore • Explain • Meaningful learning • Misconceptions • Science and Engineering Practices
Trial 1B with 15cm lever arm Position-time graph
Trial 2B with 15cm lever arm Position-time graph
Trial 1B and 2B • The average velocity for trials 1B and 2B was: • Trial 1B=1.802m/s • Trial 2B=1.783m/s Average velocity = 1.79m/s +/-0.01
Trial 3B with 15cm lever arm Position-time graph
Trial 4B with 15cm lever arm Position-time graph
Trial 5B with 15cm lever arm Position-time graph
Trials 3B to 5B • The average velocity for car B with a 15cm lever arm were: • Trial 3B=1.531m/s • Trial 4B=1.614m/s • Trial 5B=1.747m/s Average velocity= 1.64m/s +/-0.11
Trial 6B with 12 cm lever arm Position-time graph
Trial 7B with 12 cm lever arm Position-time graph
Trial 8B with 12 cm lever arm Position-time graph
Trials 6B to 8B • The average velocity for trials 6B, 7B and 8B with a lever arm of 12cm were: • Trial 6B=1.682m/s • Trial 7B=1.713m/s • Trial 8B=1.646m/s Average velocity= 1.68m/s +/-0.03
Trial 9B with a 10cm lever arm Position-time graph
Trial 10B with a 10cm lever arm Position-time graph
Trial 11B with a 10cm lever arm Position-time graph
Trials 9B to 11B • The average velocity for trials 9B, 10B and 11B with a 10cm lever arm was: • Trial 9B=1.767m/s • Trial 10B=1.766m/s • Trial 11B=1.777m/s Average velocity= 1.77m/s +/- 0.01
Trial 12B with a 8.5cm lever arm Position-time graph
Trial 13B with a 8.5cm lever arm Position-time graph