Download
1 / 61
610 likes | 736 Vues
Hawai’i’s Energy Future – A Major Step Forward 2009 Legislative Recommendations. Hawaii State Capitol December 31, 2008. Contents. Hawaii’s Energy Context – A Somber Reality 2006 Energy For Tomorrow: The Beginning of a New Path

E N D
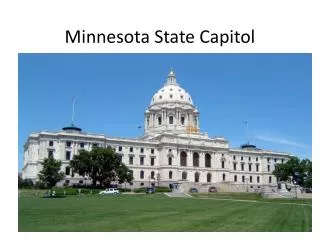
Hawai’i’s Energy Future – A Major Step Forward 2009 Legislative Recommendations Hawaii State Capitol December 31, 2008
Contents • Hawaii’s Energy Context – A Somber Reality • 2006 Energy For Tomorrow: The Beginning of a New Path • Hawaii Clean Energy Initiative: A Foundation for Transformation • 2009 Legislative Recommendations – A Major Step Forward
Reducing Hawaii’s dependence on fossil fuels is a long-standing objective Over 36 years, petroleum consumption remains at about 89% Despite objective, little progress made – the needle has not moved
Alaska North Slope oil, the basis for the design of our refineries, is no longer available US – Alaska More than 96% of petroleum in Hawaii now comes from foreign sources
Hawaii is the most petroleum dependent state Petroleum dependence for electricity – top six states
Average U.S. Residential Price: 11.3¢/KWH Residential price of electricity by island – 1st half ‘08 Source: monthly electric utility reports submitted to the Hawaii Public Utilities Commission
High energy costs multiply throughout the economy The fuel surcharge affects the cost of over 80% of the goods sold in Hawaii
Economic impact of dependence on expensive energy • Household fuels and utilities costsrose 36.4 percent, year-over-year, in the Honolulu CPI during 2Q’08 • Mainland energy costs are 4% of a state’s Gross Domestic Product; in Hawaii, it approaches 11%, almost 3 times as much • Between 2007 and 2008, State Government consumption of electricity has decreased 1.17%, but expenditures have increased 19.55%
Dependence on foreign oil = dependence on foreign political instability • October 16, 2007 -- $87.61/barrel • “Weak dollar and international tensions (anxieties over northern Iraq, where there is potential for a Turkish strike on Kurdish separatists)” • “Crude options expire tomorrow and the market was thought to be heading toward $90/bbl.” • “The market, said OPEC, is ‘very well supplied.’” • January 2, 2008 -- $100/barrel • “…a weakening dollar, the flow of money into commodities from faltering stocks and bonds, and Nigerian and Kenyan political unrest…and oncoming Winter storm, apprehension over tomorrow's DOE report” • July 11, 2008 -- $147.27/barrel • “…market watchers pointed to concerns in regards to Nigerian production, the ongoing tensions with Iran and an impending strike of Petrobras workers. In addition, dollar weakness and an early exodus from equities into oil were also considered factors today.”
Hawaii’s energy system was based on $20/barrel oil: those days are over Source: Energy Information Administration Report #DOE/EIA-0484 (June 2008)
Source: International Energy Agency To generate the energy required worldwide by the 2030s would require us to find an additional 1.4 MBD every year until then. Can Hawaii assume this will happen, and base our future on it?
Hawaii has a wealth of renewables:estimated @ 150% of current installed capacity http://hawaii.gov/dbedt/info/energy/
What has held back renewable penetration? Barriers must be removed for Hawaii to realize energy independence and economic stability
Problem: Four legacy drivers support the status quoand represent barriers to be overcome • Policy/Regulatory Framework • Utilities compensated for increased electricity sales; pass-through of fuel price increase is renewable disincentive • IPPs need transparent “rules of the road,” certainty and predictability • No clear policy support or incentives for significant new investment and technology upgrades in renewable generation, advanced transmission and distribution • Need policy on net metering, interconnection, wheeling, and utility protocols for integrating variable generation which will impact transmission and distribution systems • Technology Development & Integration at System Level • Solutions needed for reliable integration of high levels of variable renewable generation with traditional baseload generation and with existing grid • Energy storage and “firming” technologies are probably part of the solution, but which technologies will be most effective and how much storage is needed to effectively manage the grid is under development • Few incentives for advanced metering, dynamic rates, load management, demand response or distributed generation • Financing/Capital • Need a healthy and financially viable utility to make necessary investments • Significant new public and private investments required to support the magnitude of system changes needed for a clean energy future: Open up Hawaii’s markets to private capital • Costs have to be understood and rate structures designed to balance utilities' financial and consumers’ rate needs • System Planning • Hawaii’s energy system is built on the assumption of consistent supply of low-cost oil, central power plants, grids that could be continually adjusted to meet load needs; utilities are structured to control transmission and distribution as well as generation
Contents • Hawaii’s Energy Context – A Somber Reality • 2006 Energy For Tomorrow: The Beginning of a New Path • Hawaii Clean Energy Initiative: A Foundation for Transformation • 2009 Legislative Recommendations – A Major Step Forward
2006 Energy For TomorrowLandmark legislation changed the game, articulated a clear vision • “Savings through Efficiency” • Lead By Efficiency Program • Energy Star • LEED Silver • Alternative Fueled State Vehicles • Dept of Education Energy Efficiency Coordinator • “Independence through Renewables” • Renewable Portfolio Standard – 20% by 2020 • Public Benefits Fund for Demand Side Management • “Security through Technology” • State Hydrogen Program • Energy Research • “Fuels through Farming” • Alternative Fuel Standard – 20% by 2020 • “Empowering Hawaii’s Consumers” • Increase in the dollar caps for tax credits
Contents • Hawaii’s Energy Context – A Somber Reality • 2006 Energy For Tomorrow: The Beginning of a New Path • Hawaii Clean Energy Initiative: A Foundation for Transformation • 2009 Legislative Recommendations – A Major Step Forward
The Hawaii Clean Energy Initiative was launched onJanuary 28, 2008 with the signing of a Memorandum of Understanding between the State of Hawaii and the U.S. Department of Energy “…the Department of Energy will help Hawaii lead America in utilizing clean, renewable energy technologies.” Governor Lingle “Hawaii’s success will serve as an integrated model and demonstration test bed for the United States and other island communities globally...” Assistant Secretary Karsner
Hawaii Clean Energy InitiativeNational Partnership to Accelerate System Transformation The goals are: • Achieve a 70% clean energyeconomy for Hawaii within a generation • Increase Hawaii’s security • Capture economic benefits of clean energyfor all levels of society • Foster and demonstrate innovation • Build the workforce of the future • Serve as a model for the US and the world
Hawaii urgently needs to transition to an economy powered by clean energy, instead of imported foreign oil In 2004, Hawaii’s RPS included 6% renewables, which would increase only incrementally Range of scenarios under transformational assumptions (i.e., exploiting technical & economic potential) GAP Fundamental systemic transformation is required Percent Renewable Energy Range of scenarios under business as usual assumptions (i.e., attainment of RPS, RFS) …but doing so will require a substantive transformation of regulatory, financial, and institutional systems
HCEI has assessed strategic changes needed to Hawaii’s policy, regulatory, financial, & technology structures End use efficiency Policy Electric generation Regulatory Framework Integration Institutional Change Financing Energy delivery • Integration group: • Integrate strategies for policy & regulatory frameworks, financing, and technology development • Lead partnerships • Integrate regulatory & legislative recommendations • Communicate Technology Development Transportation • Technical Working Groups: • Identify barriers • Identify projects • Recommend regulatory & legislative actions • Build key partnerships
HCEI Partners and Participants tor Public Sector Industry, NGO, and Other Representatives • Hawaiian Electric Industries, HECO, MECO, HELCO • Kauai Island Utility Cooperative • Hawaii Energy Policy Forum representatives • County Economic Development Boards • Environmental organizations • Native Hawaiian community • Kohala Center • Hawaii Natural Energy Institute representatives • University and community college representatives • Private industry, e.g. General Electric, First Wind, Castle and Cooke, Hawaiian Commercial & Sugar, Gay & Robinson, Pacific Biodiesel, Puna Geothermal, others • Renewable energy project developers • Investors & financial representatives • Governor Lingle • US Congressional Delegation and staff • Hawaii Legislature and staff • County Mayors • Selected County Council members • Department of Business, Economic Development and Tourism • DOE representatives • Hawaii DOD Representatives • USDA Hawaii • Public Utilities Commission representatives • Consumer Advocate
HCEI analysis & project activities • 70% Clean Energy scenario analysis(Booz Allen Hamilton) • Hawaii greenhouse gas carbon tax/abatement analysis (McKinsey & Company) • Economic modeling of energy system • Inter-island cable: feasibility and cost/benefit studies • Technical and economic assessment of plug-in hybrid and electric vehicles • 100% Renewable Lanai • Forest City Highly Efficient Communities • Marine Energy Center • Modeling electricity grids on all islands • Maui grid integration • Bioenergy Master Plan • Wind resource and storage testing • Regulatory framework development World class studies and expertise leading to projects with a broad base of partners
HCEI Scenarios: Can we achieve 70% clean energy?Really? • First cut at order of magnitude requirements and impacts • Evaluated sensitivity to several factors • No absolutes defined in this evaluation • Most work on electricity, some on transportation, little on jet fuel • Based on current commercially viable technologies; potential game changers like OTEC and algae to energy are not considered • All scenarios are presented without imported biofuels; all scenarios can hit the goals with imported biofuels • Follow-up economic and cost/benefit impacts, refinements in progress.
8 scenarios tested the impact of energy efficiency levels,PHEV penetration, biofuels, and inter-island cabling
Summary of results for eight scenarios Example observation: While Scenarios 2 and 6 show similar results, they employ different means. Scenario 2 uses less energy efficiency and requires much more solar capacity; also its ratio of non-dispatchable to dispatchable electricity is 7.4. Scenario 6 relies more on energy efficiency (and is likely to cost less) and has a non-dispatchable to dispatchable ratio of 5.8 Note: All electricity sector numbers are in total installed capacity needed; transportation sector includes only ground transportation.
Scenario 8 ElectricityHawaii could reach 70% clean energy in the electricity sector and reduce oil imports by 20 MM bbl/year by 2030 16 14 12 10 8 Million MWh delivered capacity 6 4 2
We now know what it will take to reach 70% clean energy in 2030 Hawaii Electricity Portfolio 15,000 4365 GWh 30%Energy efficiency 10,000 5820 GWh Total GWh per year 40%Renewable energy 5000 4365 GWh 30%Maximum fossil fuel 2008 2020 2030 Note: This just reflects the 2030 targets; still need to determine/set interim targets
Scenario 8 Transportation High PHEV penetration, local biodiesel and ethanol production 800 700 600 500 400 Million gallons petroleum fuel avoided 300 200 100
Scenario 8Invest $16 billion, achieve $46.1 billion savings@ oil costs $100/barrel Figures in billion 2008 dollars (except per barrel cost) PV figures based on discount rate of 7%
Scenario 8: The probability of a negative NPV is less than 20% • Approx. 18% probability of a negative NPV result Simulation based on 1,000 runs
GOALS – State/HECO Voluntary Agreement • RPS (Renewable Portfolio Standard) • This package will increase the existing RPS to 25% by 2020 and 40% by 2030 • It will also limit the amount of biofuels that will count toward the utility obligation; until 2015, the utility can only meet 30% of its obligation by simply substituting biofuels for oil in its existing power plants • The PUC will set financial penalties for utility non-compliance • Energy Scenario Planning • To replace Integrated Resource Planning (IRP) Why is it important? Why is it important? To reach the RPS, the electricity system requires planning with clean energy as the priority An RPS is critical because it sets a long term binding target for the utility; penalties make it more than a goal 30% efficiency renewable 40% 30% fossil
ASSETS – State/HECO Voluntary Agreement • Power plant retirements • The utility commits to retiring a number of oil-fired generating units to transition away from fossil fuels • Adding RE to the grid • Addresses the core of implementation by identifying wind, ocean, biomass & other projects that the utility pledges to connect to the grid • Net metering: eliminates systemwide cap • PV host program: utility can install solar on rooftops while preserving market competition Why is it important? Why is it important? To reduce the use of oil, the utility must retire fossil-fired plants Any goal needs an implementation plan; this provision lays out the first steps to get to the 70% goal
PRICING – State/HECO Voluntary Agreement • Rate pricing • Time of use rates: let consumers benefit from using electricity at off-peak times • Clean energy infrastructure surcharge: to help fund grid upgrades • ECAC: For now, the utility will be allowed to keep passing on fuel costs via Energy Cost Adjustment Clause to maintain a financially sound utility • Feed-in Tariff • Feed-in Tariff (FiT) • Very successful in Europe • Standard prices for Power Purchase Agreements • Rather than the utility negotiating each contract, the PUC will set prices for each technology, i.e. wind, solar, ocean, geothermal Why is it important? Why is it important? A feed-in tariff provides certainty to developers and fair prices to consumers Restructuring rates will align rates and consumer price signals with clean energy goals • Decoupling • Decoupling weakens the utility bias for selling its own power before IPP power • It also decouples the utility’s revenue from the number of kilowatt-hours sold Why is it important? Decoupling ensures that the utility stays financially sound while kWh demand is driven down by energy efficiency
GRID – State/HECO Voluntary Agreement • Grid Management • The utility will be responsible for demand response, storage, and other system upgrades to help incorporate and manage renewable energy on the grid • The utility will do a big build-out of advanced metering infrastructure, which they can put into their rate base • Undersea Cable • HECO commits to working with private developers and the state to buy power from a big wind project from MauiCounty, and integrating that power onto Oahu’s grid via an inter-island cable Why is it important? A cable is a game-changer for Oahu, which has the highest demand of any island but limited RE opportunities Why is it important? New grid systems & technologies help create a 21st century grid ready for high levels of renewables
Contents • Hawaii’s Energy Context – A Somber Reality • 2006 Energy For Tomorrow: The Beginning of a New Path • Hawaii Clean Energy Initiative: A Foundation for Transformation • 2009 Legislative Recommendations – A Major Step Forward
The 2009 legislative package is one step toward the 70% clean energy goal, and it sends the message that Hawaii is serious about being a leader • How far does the 2009 legislative package go towardHCEI efficiency, generation and transportation? Indicatively: • Future Steps: • Efficiency: In the next years, the State will need to be aggressive on 1) public buildings, 2) a sizable energy efficiency program for commercial buildings, 3) zero net energy building code by 2015. Promotion and implementation of efficiency programs—e.g., on-bill financing—will be critical to realize goals • Electric Generation: The PUC will be shouldering responsibility for setting rules for feed-in tariffs, electricity decoupling, etc. PUC’s timely implementation will be extremely important • Transportation: The 2009 package is designed to catalyze a market—e.g., create infrastructure for Alternative Fuel Vehicles—so the legislative package starts the process to deliver the transformation needed to hit 70%. In 2010, we will propose policies to ensure adequate supplies of biofuels, critical to using AFVs; also we will analyze clean energy options for aviation/marine transportation • PREMISE: The primary barriers to reaching 70% clean energy are not technical or financial; they are policy-driven: change incentives and behavior by changing established framework of rules • This legislative package is one step in the process of changing the rules—to do so it’s important to view the package whole, as a comprehensive approach to energy policy, and in the context of other HCEI initiatives 70% HCEI Goal: 70% clean energy Percent Clean Energy Business as usual
Contents • Electricity Generation and Delivery • Efficiency • Transportation • Renewable Portfolio Standard (p. 4-11) • Net Energy Metering (p. 11-13) • Renewable Energy Zones and Facilitation (p. 14-22)
Renewable Portfolio Standard • Adjusts RPS Goals by statute to reflect HECO Voluntary Agreement: • 2010 = 10% (no change) • 2015 = 15% (excludes energy efficiency (EE) and displacement technology) • 2020 = 25% (increase from current 20%, excludes EE and displacement technology) • 2030 = 40% • Note: Although EE and displacement technology excluded from RPS beginning 2015; both will count towards Energy Efficiency Portfolio Standard • No new additional fossil-based-only generation to be permitted • 2 MW and below exempted (for DG stand-by, etc.) • PUC to evaluate RPS goal every 5 years beginning 2013 • Amend §269-95(4) to clarify that the PUC’s authority to revise the RPS goal; need not be based on the HNEI studies referred to in §269-95(3)
Net Energy Metering (NEM) • Allow PUC to remove limits on NEM for electric utilities as determined by the PUC • Amend sections of NEM statutes to give the PUC the authority to move net energy metered customers under time-of-use rates and feed-in tariffs – transition to smart grid regime
Renewable Energy Zones (REZ) and Project Facilitation • Amend §196-4 to expand the powers and duties of the Energy Resources Coordinator (DBEDT) to include the following: • Designate high-renewable resource areas as Renewable Energy Zones • Develop incentives to encourage development of resources within the REZ • Assist/identify the required transmission infrastructure related to the REZ • Assist in accessing special purpose revenue bonds to finance critical transmission infrastructure projects • Amend §209E-2 to include all renewable energy resources as “qualified business” in an Enterprise Zone • Include the permitting of transmission projects in the renewable energy permitting facilitator’s duties (Act 208) • Expand qualified renewable energy projects eligible for the renewable energy facility siting process to include facilities of 5-200 MW capacity, and biofuel facilities >1Mgal/year; ERC discretion to apply process • Deems a permit approved if process exceeds 18 months.
Contents • Electricity Generation and Delivery • Efficiency • Transportation • Energy Efficiency Portfolio Standard & Analysis (p. 23-26) • Building Codes (p. 26-29) • Public Buildings (p. 31-34) • On-bill Financing for Energy Efficiency and Renewable Energy (p. 34-37) • Tax Credits for Net Zero Energy Homes (p. 37-41) • Renewable Energy and Energy Efficiency Tax Credit Provisions (p. 42-51) • Consumer Information (p. 41-42)
Background • Energy Efficiency (EE) critically important to achieving HCEI’s 70% clean energy goal • Probably the most complicated and difficult component • Hundreds of thousands of individual behavior make-up inefficient energy use • Multitude of actors • Inefficient energy practices embedded in status quo • Vested and conflicting interests • Approach: • Establish target and framework • Policies phased-in over multiple years • Educate, educate, educate/lead-by-example/technical assistance/monitor & adjust • Balance being aggressive and appropriately ahead of the curve
Energy Efficiency Portfolio Standard • State sets EEPS with goal to offset forecasted load from 2009 to 2030 • HCEI goal of 4300GWh savings by 2030; PUC sets interim & per-island targets • Requires annual report from Third Party Administrator (TPA) • Renewable substitution, e.g. solar water and sea-water air conditioning, count as efficiency measures in EEPS, not generation in RPS Energy Efficiency Portfolio Analysis ($500K from PUC Special Fund) • Energy efficiency (EE) assessments to understand current energy use patterns (homes, businesses, other) and identify cost-effective, high-savings EE measures • PUC able to direct utilities to provide data as required for efficiency analysis • Assessment of all cost-effective, high-savings EE measures completed by 12/31/2010 • Until EE plan is available, PUC/DBEDT/PBA work with stakeholders to identify preliminary set of cost effective, high savings EE measures for PBA to implement
Building Codes • Amend initial code adoption timeframe for county adoption of code…one year, not two years • State Building Code Committee (SBCC) shall adapt and adopt latest International Energy Conservation Code (ECC) updates within 6 months of adoption by International Code Council; each county shall adapt and adopt the updates within 6 months of SBCC adoption or SBCC update shall become county code if not adopted within 6 months.
Building Codes ($600,000 PUC Special Fund ) • PBFA shall • conduct measurement and verification of buildings/home constructed under the code to assess performance; • conduct surveys to determine actual costs to build following the building code; • work with stakeholders to identify cost effective measures; • make recommendations to the building code; • create commissioning guidelines; • assess implementing residential/commercial net zero energy building code; • annually report analyses and surveys. • Building permit application must designate commissioning agent; counties authorized to set fines if defciencies identified by commissioning agent not remedied within 60 days.
Public Buildings • State agencies shall benchmark existing public buildings to determine energy efficiency improvements needed. • Target performance for major renovations/retrofits of existing public buildings will be 30% above building code. • Public buildings shall be retrocommissioned/recommissioned every 5 years. • Retrofits: achieve efficiency savings that can be recouped within 20 years. • Agencies may use energy performance contracts and may keep at least 50% of the savings . On-bill Financing for Energy Efficiency and Renewable Energy • By 12/31/2009, PUC institute Pay As You Save (PAYS) program for residential and small commercial customers; administered by PBA; PUC may conduct evaluation of program effectiveness. • Expand to include installation of photovoltaic systems and solar water heating, change out of primary refrigerators to higher efficiency models; cost-shared energy audits for customers.
Tax Credit for Net Zero Energy Homes • Tax credit $5K max per home; amount of credit based on total sq-footage; max for multi residential is $2K per unit with individual meters; commercial buildings are eligible for up to $50K. • Builders to new/retrofit homes with smaller square footage receive higher tax credit; tax credit decreases as home increases in size. • ERC reviews the program and recommends amendments. • Tax credit effective 1/1/2010 to 12/31/2015. (Estimated impact: $900,000 for 1/1/2010 to 12/31/2015 -- DBEDT est. 150 single family homes for total credits of $750,000; 25 units in multi residential for total credits of $50,000; 2 commercial installations for total credits of $100,000)