Download
1 / 20
200 likes | 311 Vues
UK Transport Energy Demand. By Scott Martin 24 th February 2005. What’s the story?. Energy consumption in the transport sector represents the largest of any sector, accounting for 33% of the total UK energy demand in 2003

E N D
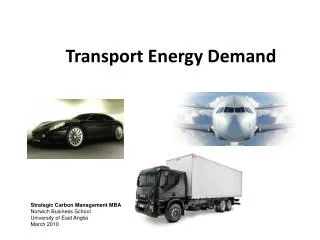
UK Transport Energy Demand By Scott Martin 24th February 2005
What’s the story? • Energy consumption in the transport sector represents the largest of any sector, accounting for 33% of the total UK energy demand in 2003 • Has risen dramatically since the 1960’s as with other industries, putting an extra burden on the natural resources of the planet
What’s the story? • Growth at rates seen previously cannot continue into the future • Vital that this demand is reduced or more sustainable fuels sources are found if we want any chance of meeting government targets for emissions reductions
Why has this happened? • Car ownership has increased • Distance travelled has increased • Cost of private motoring fallen • Low cost airlines
Increased car ownership • 20 Million more vehicles today than 40 years ago • Retail prices of vehicles has fallen and is still falling relatively to wages • Road building schemes make travel easier • Increased disposable income • Status symbols • Safety improvements
Increases in distances travelled • People are travelling 3.5 times as much, by whatever means as they did in 1950’s • Similar reasons to ownership • Cost per mile/km getting cheaper • More people with licence • Bigger safer roads • Travel perceived as easier
Cost of travel • Private motoring is the only form of travel not to have increased relatively in price over the last 25 years • This makes other, more efficient forms of travel less attractive, so use of rail etc. declines
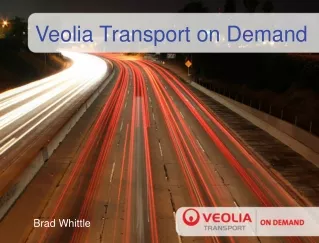
Low cost airlines • Ryan Air, Easy Jet most popular • Opened up market for air travel within UK • Increased number of journeys to European destinations • No VAT or tax on aviation fuel • Flights for as little as 99p • How can other travel methods compete when prices are this low and so quick?
Future projections • Based on past trends, I expect that the energy required for a light vehicle to travel 1km will continue to reduce, but will have limits
Future projections • Eventually the market for new vehicles will become saturated, and growth will slow
Future projections • Energy demand from light vehicles will show a gradual increase as efficiency reaches its limits
Future projections • Demand in most other transport areas will also grow, similar to light vehicles • Shipping and railways may decline, depending upon level of investment • By 2030, I also expect that a larger proportion of the energy for transport will not be sourced from petroleum, although exactly where it will come from and therefore demand for this alternative cannot be accurately predicted with any great certainty at this time
Overall • I believe that the energy consumption in the transport sector as a whole will grow at least by 1.0% each year but could be as much as 2.5% • My ‘Low Growth’ predictions therefore use 1.0% as the annual increase • And my ‘High Growth’ predictions take 2.5% as the annual increase
Low Growth Year PJ 2010 2746 2020 3033 2030 3350 High Growth Year PJ 2010 3000 2020 3840 2030 4915 Projected transport demand figures