Download
1 / 28
290 likes | 685 Vues
Introducing Health Catalyst. June 11, 2014. Patients. Hospitals. Clinics. Our Story…. 30M. 135. 1700. What does Health Catalyst offer?. Services Installation Services, Clinical Improvement Services. Services Install technology and ignite change. Analytic Applications

E N D
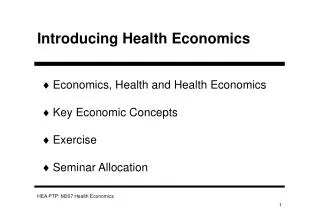
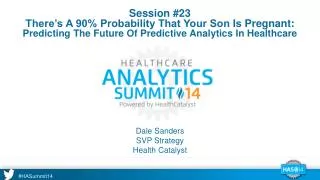
Introducing Health Catalyst June 11, 2014
Patients Hospitals Clinics Our Story… 30M 135 1700
What does Health Catalyst offer? Services Installation Services, Clinical Improvement Services Services Install technology and ignite change Analytic Applications Key Process Analysis, Dashboards, Advanced Analytics Applications Accelerate insight Late-Binding™ Data Warehouse Platform Data Warehouse, Architecture, Metadata Management, Security, and Auditing Data Warehouse Integrates and organizes data
High Level Timeline Achievement Level 1 Kickoff Contract Month 0 Month 3 Month 6 Implementation Planning Platform Installation and Training Applications Installation and Training Testing and Validation
Early-Term Deliveries Labor Costs • 2% reduction in total salaries and benefits • 500% increase in using data to drive staffing decisions • 66% increase in speed of data availability • 75% reduction in elective early-term deliveries • Earned $200,000 payer bonus payment Heart Failure Readmits Sepsis • 21% lower 30-day readmits • 14% lower 90-day readmits • 63% increase in med rec within 48 hours of discharge • 2X phone call follow up • In 12 months: • 22% reduction in sepsis mortality • $1.3M cost savings
Success Stories (continued) Improved Appendectomy Outcomes Improve Asthma Outcomes • 36% reduced LOS • 19% reduced direct costs • 36% increased order set use • 53% increased recommended antibiotic usage • Decreased LOS by 11 hours • Decreased X-ray by 49% • 67% increase in order set use • 90% use of asthma action plan Streamline Operations Data and Reporting Demands • 67% reporting cost reduction (from 97 to 30 hours) • 25% faster reporting turnaround • Gained $1M est. billable charges by minimizing procedure referral leakage • Automated reporting with an est. $400K savings
Roadblocks to Success • My analysts spend way too much time collecting data and not enough time interpreting data. We seem to be able to improve care, but it isn’t sustainable. As soon as we move to our next project, the last improvement suffers. We have all kinds of dashboards but they are not helping me improve care. We are not looking at relevant data.
Poll Question • Which common roadblock resonates the most with you? 98 Respondents • Analysts spend too much time gathering data – 46% • Reports and dashboards not showing relevant data – 30% • Difficulty achieving sustained improvements – 23%
Three Critical Elements of Success It’s more than just analytics • My analysts spend way too much time collecting data and not enough time interpreting data. We seem to be able to improve care, but it isn’t sustainable. As soon as we move to our next project, the last improvement suffers. We have all kinds of dashboards but they are not helping me improve care. We are not looking at relevant data.
Agenda • Platform Discussion • Demo: Key Process Analysis • Demo: Heart Failure Readmissions • Additional Applications Overview • Conclusion
Late-BindingTM Data Warehouse Platform Fast-tracking Analytics and Content Subject Area Data Marts Applications Present actionable data to deployment teams Community Care Dashboard Financial Management Explorer Heart Failure Subject Area Mart Designer Create and manage content Linking & Standardization Common Linkable Identifiers, Patients, Labs, Encounters, Diagnoses, Medications, etc. Content Population Definitions (800+), Hierarchies, Comorbidities, Risk Stratification, Attribution Atlas View content definitions and lineage Source Marts Atlas Provide insight into analytics system source metadata EMR Financial Patient Sat. HR Administrative Claims EMR Financial Patient Sat. HR Administrative Claims Source Mart Designer Accelerate analytics with single source of truth e.g. Lawson, Peoplesoft, Ultipro e.g. Epic, Cerner NextGen e.g. EPSi, Peoplesoft, Lawson e.g. Press Ganey, NRC Picker e.g. Medicare Private Payers e.g. API Time Tracking
Content ClinicalHierarchy Organize codes into a clinically meaningful hierarchy Clinical Program i.e. Cardiovascular 12 Care Process Family i.e. Heart Failure 92 Care Process i.e. AMI 455 Codes APRDRG, ICD PX, ICD DX, CPT Tens of thousands
Content KPA: Measuring Opportunity Using provider variation to calculate the potential financial impact of improving and standardizing care processes Mean Cost per Case = $10,000 Dr. J. 15 Cases $15,000 Avg. Cost Per Case Total Opportunity = $75,000 Total Opportunity = $1,200,000 Total Opportunity = $175,000 Total Opportunity = $500,000 $4,000 x 25 cases = $100,000 opportunity $5,000 x 15 cases = $75,000 opportunity Cost Per Case, Vascular Procedures
Key Process Analysis Analytic Uses clinical hierarchy to stratify according to classifications that match care delivery Uses calculations that identify variability Content Deployment teams use this to prioritize improvement efforts Deployment Uses data warehouse and relevant content to determine the greatest opportunity for quality improvement/cost reduction
Heart Failure Readmissions Introduction Deployment Content Analytic • Implementation workgroup is comprised of both clinical and technical people. Implementation workgroup defines: • Improvement Aim Statement • Population Definition • Interventions to Support Aim • Data Mart and Visualization allow visualization of metrics and stratification by risk
Heart Failure ReadmissionsConclusion Analytic Multiple cohort definitions, risk stratification models, and evidence-based metrics focused on aim of reducing readmissions Content Care improvement teams use agile improvement methodology to incorporate content and use application reports to identify high-risk patients for intervention Deployment Baseline readmission metrics presentation with drill-down to patient-level intervention reports ranked by predictive risk score
Product Portfolio Foundational Applications Discovery Applications Advanced Applications EDIT—Executive Dashboard Integration Tool (Key Performance Indicator editable collage from all app categories) CAFE—Comparative Analytics Framework and Exchange—across Healthcare Systems and National Benchmarks Pareto Tool (KPA) Population Suitese.g., Ischemic Heart Disease Population Explorer Cohort Builder Patient Satisfaction Explorer Population Modules e.g., CABG, Stent, AMI Comorbidity Analyzer General Ledger Explorer Regulatory Explorer Readmission Explorer Workflow / Operational Suites e.g., Acute Medical Attribution Modeler Practice Management Explorer Suite Workflow/Operational Modules e.g., ICU, MedSurg, Emergency ACO Explorer Suite Patient Flow Explorer Readmission Predictor Financial Management Explorer Patient Injury Prevention Suites e.g., Infection Prevention Payment Model Analyzer Labor Management Explorer Metric Correlation Analyzer Patient Injury Prevention Modules e.g., CAUTI, CLABSI, SSI Patient Flight Plan Predictor Rev Cycle Explorer Late Binding™ Data Warehouse Platform Available Now Available 1H 2014 Available 2H 2014 Roadmap Source Marts Security and Auditing Atlas Source Mart Designer Metadata Engine SAM Designer IDEA
Population Explorer Explore metrics across the continuum of care for 800 pre-defined populations
Community Care Screening and chronic disease management
Financial Management Explorer Analyze costing, billing, and payment information alongside financial and volume metrics.
Implementation 3 Achievement Level +SAM Designer +All Platform Components +All Foundational +4 Discovery +5 Population Modules +3 Workflow/Operational Modules +2 Patient Safety Modules Achievement Level Atlas Instant Data Entry App (IDEA) 3 Source Marts 5 Foundational Apps 2 Discovery Apps (incl. KPA) 1 3 Months 1 Year 2 Years 3 Year to Ongoing 4 2 Achievement Level +5 Source Marts +Source Mart Designer +4 Foundational Apps +3 Discovery Apps 1 Population Module 1 Workflow/Operational Module Achievement Level Access to Full Library + 10 Advanced Apps/Year
…Back to the Catalyst Story • Our approach to success starts with our creation story and predates our company • Our goal is to install and configure technology as means to an end. We want all of our customers to have ‘success stories’! 2008 2014
Poll Question • Which do you think your organization needs the most help with? 85 Respondents • Select all that apply: • Analytics – 54% • Content – 40% • Deployment – 31%
Thank You Upcoming Educational Opportunities • The Analytic System: Discovering Patterns in the Data • Date: June 25, 1-2pm, EST • Presenter: Dr. John Haughom, Senior Advisor, Health Catalyst • Register at http://healthcatalyst.com/ • Healthcare Analytics Summit • Join top healthcare professionals for a high-powered analytics summit using analytics to drive an engaging experience with renowned leaders who are on the cutting edge of healthcare using data-driven methods to improve care and reduce costs. • Date: September 24th-25th • Location: Salt Lake City, Utah • Save the Date: http://www.healthcatalyst.com/news/healthcare-analytics-summit-2014 For Information Contact: Eric.Just@healthcatalyst.com Mike.Doyle@healthcatalyst.com
OBJECTIVE Obtain unbiased, practical, educational advice on proven analytics solutions that really work in healthcare. The future of healthcare requires transformative thinking by committed leadership willing to forge and adopt new data-driven processes. If you count yourself among this group, then HAS ’14 is for you. MOBILE APP Access to a mobile app that can be used for audience response and participation in real time. Group-wide and individual analytic insights will be shared throughout the summit, resulting in a more substantive, engaging experience while demonstrating the power of analytics.