Download
1 / 25
260 likes | 427 Vues
Measurement and Error. In small groups. Each group must invent a new unit of measurement Use the new unit to determine the area of the classroom Compare your group’s unit to another What is the conversion factor between the two different units?

E N D
In small groups... • Each group must invent a new unit of measurement • Use the new unit to determine the area of the classroom • Compare your group’s unit to another • What is the conversion factor between the two different units? • How would other students in another place be able to use your unit?
Can you hit the bull's-eye? Three shooters with three arrows each to shoot. How do they compare? Both accurate and precise Precise but not accurate Neither accurate nor precise Can you define accuracy and precision based on the graphics above?
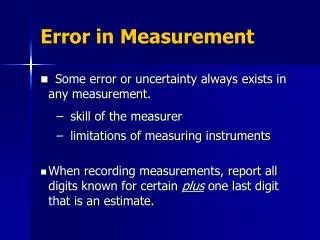
Some terminology • True value – standard or reference of known value or a theoretical value • Accuracy – closeness to the true value • Precision – reproducibility or agreement with each other for multiple trials
A group measurement task… Using a metric stick, determine the diameter of the ball provided. Compare your results with another group. Any problems with your measurement?
Can all errors be controlled? • What are some possible things that can be done to minimize errors?
Types of Errors • Determinate (or Systematic) • Sometimes called bias due to error in one direction- high or low • Known cause • Operator • Calibration of glassware, sensor, or instrument • When determined can be corrected • May be of a constant or proportional nature
constant or proportional error… Proportional error influences the slope. Constant error influences the intercept.
Types of Errors continued • Indeterminate (or Random) • Cannot be determined (no control over) • Random nature causes both high and low values which will average out • Multiple trials help to minimize
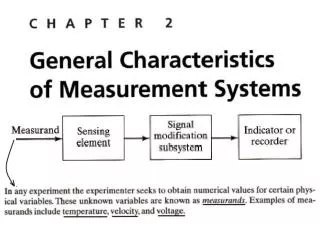
Sources of Error sampling Representative sample homogeneous vs. heterogeneous preparation Loss Contamination (unwanted addition) analysis Measurement of Analyte Calibration of Instrument or Standard solutions How about sampling a chocolate chip cookie?
How do you assess the total error? • One way to assess total error is to treat a reference standard as a sample. • The reference standard would be carried through the entire process to see how close the results are to the reference value.
Expressing accuracy and precision • Mean (average) • Percent error • Range • Deviation • Standard deviation • Percent coefficient of variation accuracy precision
Accuracy and Precision The center of the target is the true value.
Both a & p P only Neither a nor p
Both a & p P only Neither a nor p
How would practice in target shooting or making a measurement influence the results? • To judge the accuracy of an analysis, what is required?
Population Actual variation in the population Sample – part of population Estimates the variation in the population May not be representative sample Standard Deviation of the…
A sampling activity • From the bag of poker chips (THE POPULATION), containing two colors, pull out FIVE chips (THE SAMPLE). Record your results and calculate the %white. • Place your five chips back into the bag. • Repeat the five chip sample four times.
When the chips are down! • How would you characterize the results of the multiple sampling? • Do you need to take more samples of five chips? • Would collecting a larger sample, say 10 chips, improve your results?
Population Sample • THE SAMPLE STANDARD DEVIATION allows for more variation in the sample compared to the population, since sample is only part of population. Dividing by n-1 increases the estimate of the population variation. This attempts to eliminate the possibility of bias. • On the TI-83, the sample standard deviation is given as Sxwhen you do 1-Var Stats under [STAT] CALC. In Excel, use STDEV under insert function, fx
Graphical methods • Scatter plots Most accurate and precise Systematic error? Worst precision CHM 103 webpage
Box and whisker plot on TI-83 Small variation Large variation median range
Let’s examine some results for two students analyzing two different CaCO3 antacid tablets True value Which student has the more accurate results? Which student has the greater precision?
How are we going to address these questions? %CV %Error What does the sign of the percent error tell you about the error?
and always remember to… • Make all measurements carefully and check your results or readings a second time. • Read all devices to as many places as possible (significant figures): calibration marks + one more place • A buret, which is calibrated to 0.1 mL, can be read to 0.01 mL. • A thermometer marked every degree can be read to 0.1 degree