1 / 1

table s6 GO

branxton
Télécharger la présentation

table s6 GO

An Image/Link below is provided (as is) to download presentation Download Policy: Content on the Website is provided to you AS IS for your information and personal use and may not be sold / licensed / shared on other websites without getting consent from its author. Content is provided to you AS IS for your information and personal use only. Download presentation by click this link. While downloading, if for some reason you are not able to download a presentation, the publisher may have deleted the file from their server. During download, if you can't get a presentation, the file might be deleted by the publisher.

E N D

Presentation Transcript


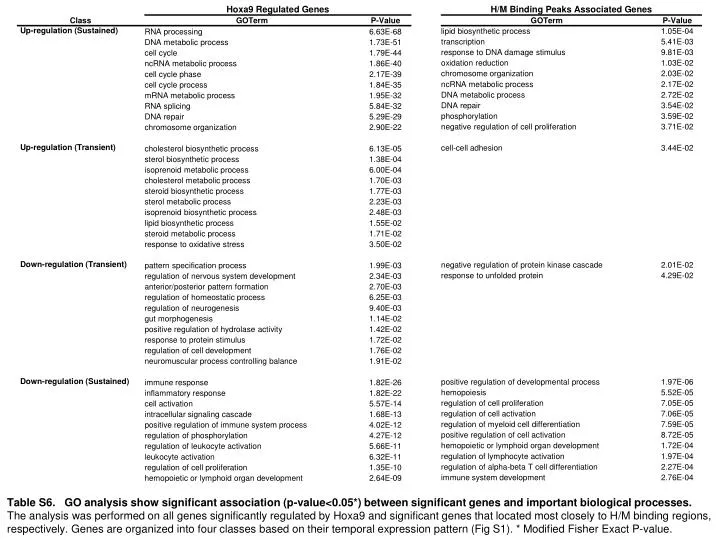
  1. Table S6. GO analysis show significant association (p-value<0.05*) between significant genes and important biological processes. The analysis was performed on all genes significantly regulated by Hoxa9 and significant genes that located most closely to H/M binding regions, respectively. Genes are organized into four classes based on their temporal expression pattern (Fig S1). * Modified Fisher Exact P-value.

More Related