Download
1 / 8
80 likes | 241 Vues
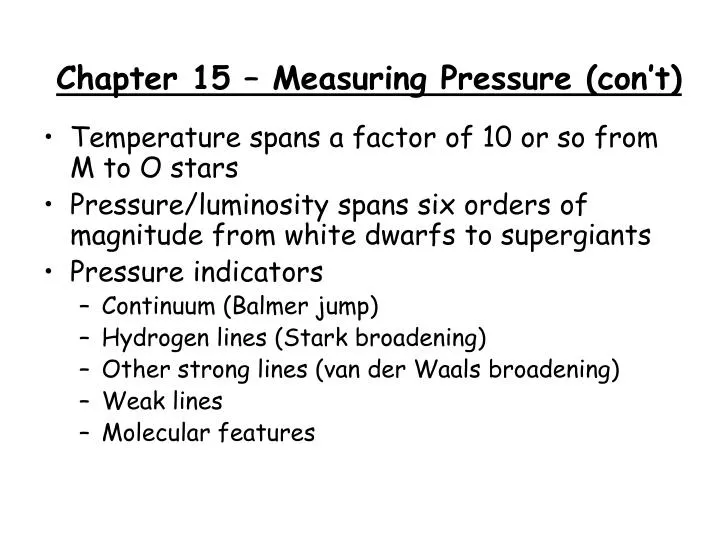
Chapter 15 – Measuring Pressure (con’t). Temperature spans a factor of 10 or so from M to O stars Pressure/luminosity spans six orders of magnitude from white dwarfs to supergiants Pressure indicators Continuum (Balmer jump) Hydrogen lines (Stark broadening)

E N D
Chapter 15 – Measuring Pressure (con’t) • Temperature spans a factor of 10 or so from M to O stars • Pressure/luminosity spans six orders of magnitude from white dwarfs to supergiants • Pressure indicators • Continuum (Balmer jump) • Hydrogen lines (Stark broadening) • Other strong lines (van der Waals broadening) • Weak lines • Molecular features
Molecules • Hydrides, oxides, other diatomic molecules (CN, C2) • Molecular equilibrium depends on pressure • Different molecules depend on pressure in different ways • Molecules are also sensitive to other abundances (C2, for example – C and O) • Molecules in these spectra include • TiO (6200-6300) • CN (4215, 3883) • CH (G-band, 4300) • MgH (5200, near Mgb lines) K4 V K4 III
Disentangling Temperature and Pressure • Weak lines vary with both pressure and temperature • Pressure can be determined independently if lines from two different ionization states are present (Fe I and Fe II, Ti I and Ti II) • Generally, fix temperature & abundance from neutral lines, set gravity so ionized lines agree with abundance from neutral lines
Getting Temperature and Pressure Simultaneously • Select lines sensitive to pressure (preferably weak ones – why?) • Assume metallicity and microturbulence • Determine log g vs. Teff curve that produces correct equivalent width for each line • Intersection of all such curves should be the correct temperature and gravity
In reality… • Various temperature, pressure methods subject to uncertainties • Temperature and gravity often not well constrained Hundt et al. 1972, A&Ap, 21, 413; “Analysis of the Spectrum of the Metal Line Star 63 Tau”
The Wilson-Bappu Effect Wilson 1976, ApJ, 205, 823 • The strength of the emission in the core of the Ca II K line is a function of luminosity • Empirical calibration (for giants): Mv = alogW0 + b • Uncertainty ~ 0.5 mag (1s) • ditto for Mg II h&k lines Higher luminosity > Bigger radius > Lower gravity > More gradual drop in pressure > More extended chromosphere > More emission
Helium • Can’t see it in stars cooler than A0… but it’s there! • He increases mean molecular weight of gas – larger pressure at a given optical depth because the mass absorption coefficient is less • Effects generally modest for small changes in the He abundance • But note He rich stars – supergiants, hot subdwarfs, HB stars, post-AGB stars, white dwarfs
Surface Gravities from Binaries • Visual binaries - well determined orbits + parallax > masses • Eclipsing binaries > accurate masses independent of distance Inferring Gravity • Spectral type • Log g vs. (B-V) • Matching stellar evolution models (Teff and Mv) (recall Arcturus…)