Download
1 / 47
470 likes | 717 Vues
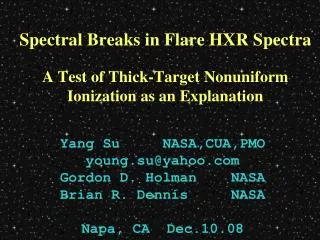
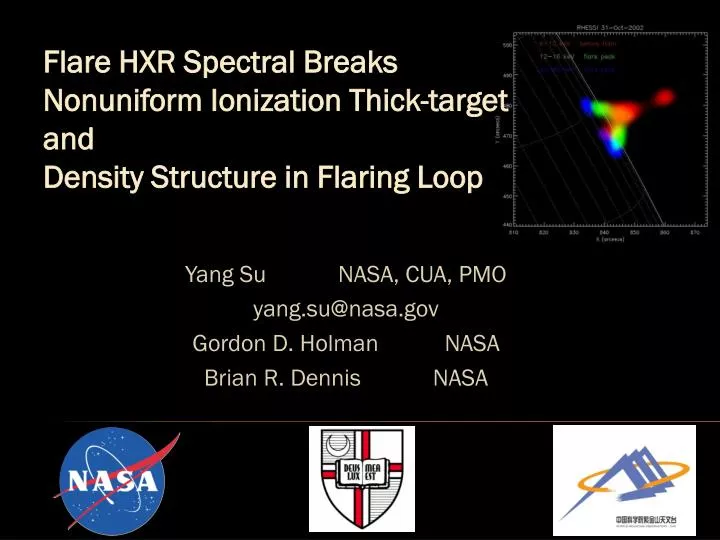
Flare HXR Spectral Breaks Nonuniform Ionization Thick-target and Density Structure in Flaring Loop. Yang Su NASA, CUA, PMO yang.su@nasa.gov Gordon D. Holman NASA Brian R. Dennis NASA. Appetizer. RED : Low energy Green: Blue: High energy.

E N D
Flare HXR Spectral BreaksNonuniform Ionization Thick-targetandDensity Structure in Flaring Loop Yang Su NASA, CUA, PMO yang.su@nasa.gov Gordon D. Holman NASA Brian R. Dennis NASA
Appetizer RED : Low energy Green: Blue: High energy
Nonuniform ionization (NUI) thick target and photon spectral breaks (turn over?) Evidence for the full spectral features of NUI Density distribution along the flare loop and its time evolution Menu
Solar flare HXR spectra • often have a spectral break (turn over?) that evolves with time (Dulk et al. 1992; Lin & Schwartz 1987) • break energy: typically between ~50 and 150 keV • Spectral breaks are important to understand • acceleration mechanisms • electron propagation and energy losses • relationships between flare X-ray sources, radio sources, and particles Dish1/3 NUI
Processes that affect the spectra directly: • Instrumental effects, such as pulse pile-up (Smith et al. 2002) and non-solar background counts • Additional components, such as: • Albedo photons reflected by photosphere (Kontar et al. 2006; Kontar & Brown 2006; Zhang & Huang 2004) • Emission from thermal plasma Dish1/3 NUI
Processes that affect the photon spectra indirectly through features in the distribution of the accelerated electrons: • Non-power-law electron distribution from the acceleration process, e.g. • a double power-law electron distribution • a low-energy cutoff (Gan et al. 2002; Sui et al. 2007) • a high-energy cutoff (Holman 2003) • An anisotropic electron pitch-angle distribution (Petrosian 1973; Massone et al. 2004) • Beam-plasma instability (Holman et al. 1982; Melrose 1990) • Return current energy losses (Knight & Sturrock 1977; Zharkova & Gordovskyy 2006) • Nonuniform target ionization (Brown 1973; Brown et al. 1998; Kontar et al. 2002) Dish1/3 NUI
Dish1/3 NUI x(N)= Nonuniform target ionization • Electron energy losses are lower in un-ionized or partially ionized plasma than in fully ionized plasma (Brown 1973), • where x(N) is the ionization rate, E is electron energy and N is column density. • We use the bremsstrahlung cross section from Haug, which closely approximates the full relativistic Bethe–Heitlercross section instead of the Kramers approximation.
Why do we need NUI Thick Target assumes that the non-thermal electrons injected into a fully ionized target lose all their energy due to Coulomb collisions and also produce bremsstrahlung X-ray emission (Brown 1971). In reality, high-energy electrons can penetrate into the lower atmosphere that is colder and un-ionized Therefore, the nonuniform ionization thick-target model (NUI) was presented (Brown 1973, Kontar et al. 2002, Su et al. 2009). Dish1/3 NUI
Dish1/3 NUI Effective column density M: E02= 2K’M=2K’ Relation between M and column density N : M=
Comparison of two thick target models: Fully Ionized target and Nonuniform ionization target Dish1/3 NUI
Monte Carlo Method (available in OSPEX) to determine the uncertainty on each fit parameters Get best-fit parameters by fitting the measured count rate spectra Add background to the expected count flux (model flux) and use the Monte Carlo method to randomly vary the total counts in each energy bin following a Poisson distribution. The new count rate spectrum is fitted again to get new parameters. Repeat steps 1-3 for 2000 times to obtain a probability distribution for each parameter. Find the 95% confidence interval of the distribution (~4σ range). Dish1/3 NUI
The upper limit ∆γmodel =γmax-γminas a function of δ (the solid line) an upper limit between ∼0.2 and 0.7 that depends on the power-law index δ ∆γdata =γ2-γ1 Dish1/3 NUI
Dish1/3 NUI Three examples poor χ2 and systematic variations in residuals
RHESSI flare sample 2002 February 12 - 2004 December 31. Non-solar and particle events were excluded. 12-25 keVcount rate > 300 counts s-1 detector-1. the 50-100 keV count rate required to be at least 3σ above the background count rate. Radial distance > 927″ from disk center (>~ 75 degrees longitude at the solar equator). This minimizes the impact of albedo on the X-ray spectrum (Kontar et al. 2006) Detector corrected count rate live times> 90%. This minimizes the impact of pulse pile-up (Smith et al. 2002; Kašparová et al. 2007). This gave a final sample size of 20 flares. Dish1/3 NUI
Example of distribution of Δγdata Dish1/3 NUI
Photon spectral index γ for five models with δ=4 Dish1/3 NUI
There is an upper limit (between ∼0.2 and 0.7) on ∆γdata, which depends on δ. • In 20 flares • 5 have single power-law , 15 have spectral break • ∆γdata: 0.34 - 1.45 • E*: 31 - 107 keV • At least 6 flares can not be explained by nonuniform ionization alone. • All the four flares that have a single source show a spectral break with ∆γdata between 0.5 and 1.2. • All the five flares which do not show a spectral break have at least two sources. • A linear function does not give a better fit (for current data). Dish1/3 NUI
The upward break usually can not be observed. • When can we see the upward break? • δ is large (electron distribution power-law is steep) • E* is large enough • Thermal emission is weak Dish2/3 Evidence For Both breaks
GOES X1.2 class flare 31 Oct. 2002 16:51:08 UT Intervals 1-6 (8 s each) It has the largest E* (107.2 keV) in the sample of 20 flares (Su et al. 2009). Dish2/3 Evidence For Both breaks
Time evolution of E* Column density of fully ionized plasma increased with time Dish2/3 Evidence For Both breaks
Decay phase, EIT 195 Dish 2/3 Evidence For Both breaks
The 6-12 keV images at 17:17 UT and 17:26 UT Dish 2/3 Evidence For Both breaks
Interval 3: • Upward break at 30 keVand downward break at 49 keV • Single T : 21 MK • E* is about 65 keV. • Interval 4: • Upward break at 49 keVand downward break at 134 keV • Two T : 19 MK, 41 MK • E* is about 117 keV • Interval 5: • Upward break at 58 keV • The downward break moved out of the observation range. • Two T : 15 MK, 41 MK • E* is about 214 keV. • The column density N* continued to increase during the HXR peak and the spectral index followed a soft-hard-soft time evolution. Dish2/3 Evidence For Both breaks
Dish 3/3 Density Distribution • Spectra for upper source and lower source (at depth ER) • Ratio of lower source and upper source (Lower/Upper) • NR=2.26×10¹⁷ ER2 (ER in keV, ER < E*) • Occulted flare and the upper source
Dish 3/3 Density Distribution e- x=1 ER E* x=0
Dish 3/3 Density Distribution For ER < E* For ER > E*
Explanations for upward break • An additional thermal component at high temperature. • a temperature of 51, 71 and 89 MK would be needed for interval 3, 4 and 5, respectively, to explain the upward break. • A combination of two or more nonthermal spectral components with different slopes. • the sum of spectra from two or more sources with different spectral indexes • the rapid changing spectra with time that have different spectral indexes at different sub time intervals within the integration time. • Acceleration mechanism • Nonuniformionization in the thick target region. Dish2/3 Evidence For Both breaks
Previous methods • Emslieand Machado 1987, Veronig and Brown 2004, and Liu et al. 2009 • Brown et al. 2002 and Ashwanden et al. 2002. • Exponential density distribution • Prato et al. 2009 • Power-law density distribution • One has to assume a density distribution first. Dish 3/3 Density Distribution
Use the flux ratios of the two sources at different energies Dish 3/3 Density Distribution
Fit results for three ER Dish 3/3 Density Distribution • Wider energy bins
Dish 3/3 Density Distribution Direct fit to the spectra from two sources. ER-> NR -> Densities (n) Notice the flattening in the spectra of lower source
1.1×10¹¹, 3.5×10¹¹ and 1.7×1012 cm-3 at the depth of 4.7, 7.1 and 8.5 Mm below the top of the loop ,respectively. Dish 3/3 Density Distribution
Assumed power-law density distribution Dish 3/3 Density Distribution
Assumed double power-law density distribution Dish 3/3 Density Distribution
30-34 keV for interval 2—6 , D1-D8 Dish 3/3 Density Distribution
Dish 3/3 Density Distribution Ratio VS Column density Model Ratio VS Depth Data
Interval 3, before peak Dish 3/3 Density Distribution
Interval 3 as example Dish 3/3 Density Distribution
Emslie and Nagai 1985 Dish 3/3 Density Distribution Density distribution and time evolution
Log-log plot of density-depth distribution Dish 3/3 Density Distribution
Advantages: • No need to assume the density distribution. • Can obtain results from single image. • Can improve results using images in multiple energy bands. • Takes nonuniform ionization into account. • Disadvantages: • Need good images (with extended source structure) • May need good imaging spectroscopy to get electron distribution Dish 3/3 Density Distribution
Pixon D1-D9 MEM D3-D9 Pixon D1-D9 Variable flux correction onoff Image center can change the structure Other stuff