Download
1 / 46
520 likes | 1.03k Vues
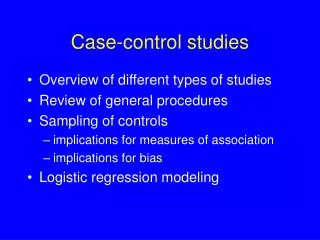
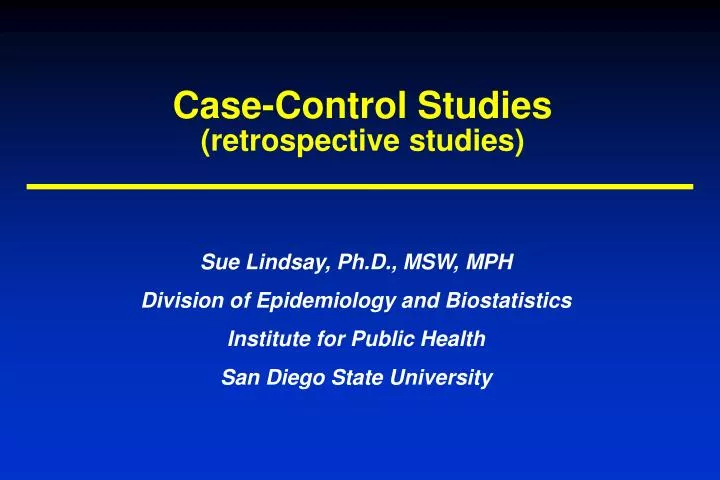
Case-Control Studies (retrospective studies). Sue Lindsay, Ph.D., MSW, MPH Division of Epidemiology and Biostatistics Institute for Public Health San Diego State University. Case Control Study Design. select. Source Population. select. Cases: With Disease. Controls: No Disease.

E N D
Case-Control Studies(retrospective studies) Sue Lindsay, Ph.D., MSW, MPH Division of Epidemiology and Biostatistics Institute for Public Health San Diego State University
Case Control Study Design select Source Population select Cases: With Disease Controls: No Disease Exposed to risk factor Not exposed to risk factor Not exposed to risk factor Exposed to risk factor
Case-Control Study Design • The hallmark of the case-control study design is that it begins with cases and compares them with non-cases (controls). ASSESS EXPOSURE SOMETIME IN THE PAST SELECT CASES AND CONTROLS Start here
Design Considerations • These investigations are initially oriented to disease status • The objective is to compare the odds of exposure among persons with the disease to the odds of exposure among persons without the disease • You need a well-defined source population • How well can you identify individuals with the disease? Case identification should be as complete as possible within the source population. • The sample of cases should be representative of all cases.
Design Considerations • The sample of controls should be representative of the general population. • Can you accurately detect exposures to your risk factor? • When possible verify exposures by multiple methods: interview, medical record review, blood test etc. • How should you select your cases? How should you select your controls? • Selection of cases or controls should not be influenced by prior exposure to the risk factor.
Steps in Conducting Case-Control Studies 1. Select source population 2. Identify and select cases 3. Identify and select controls • Match cases to controls • Group matching or individual matching? 4. Measure exposure in cases and controls 5. Compare odds of exposure in diseased to odds of exposure in non-diseased persons.
Sources of Case Selection • Population-based case-control studies • Surveillance systems • Patients identified by: • Physician practices • Clinics • Registries • Hospitals • Hospital-based case-control studies • Cases admitted to a hospital or hospitals
Issues in Case Selection • Are the cases selected representative of all cases in the community? • Are there institutional or hospital differences which may affect the study? • Are there physician practice differences that may affect the study? • Should you use incident cases or prevalent cases?
Must be able to identify new cases Survivorship/risk bias less of a problem Early deaths will still be excluded More cases available May over-represent survivors Risk factors may be associated with survivorship Incident or Prevalent Cases? Prevalent Cases Incident Cases
Characteristics of Controls • Should be from source population • Should be representative of general population, or at least the source population • Should be comparable to cases except on risk factor • Random selection when possible • Selected independently of exposure • Should be from same sampling time frame • Should be “at risk” for being categorized as a case
Sources of Population-Based Controls • Random sample of total population • Random sample from source population • Neighborhood controls (random households) • Primary care clinics, private practice offices • Other diseases – registries • Friends
Hospital-Based Controls • Captive population • Poorly defined reference population • Not comparable to general community • Possibly older, sicker, risk factor differences • Use a sample of all other patients admitted? • Select specific diagnoses for control group? • What diseases to include and exclude in the control group?
Selection Bias Disease No Disease Not Exposed Exposed Selection bias stems from an absence of comparability between the two groups being studied (cases and controls).
Misclassification Bias Disease No Disease Not Exposed Exposed Incorrect determination of exposure or outcome or both. Non-differential misclassification bias Differential misclassification bias Diagnostic suspicion bias particularly challenging
Case-Control 2 X 2 Table Cases First Select Controls a b Exposed (+) c d Not Exposed (-) a + c b + d Then Classify Exposure
Case-Control Analysis • In case-control studies we cannot calculate risk or incidence: therefore we cannot calculate relative risk as we can in cohort studies • Instead, calculate the Odds Ratio (OR). Based on the concept of relative odds of disease
Case-Control Analysis Odds of case exposure Odds of control exposure Proportion cases exposed Proportion controls exposed Proportion cases not exposed Proportion controls not exposed
The Case-Control 2 X 2 Table Controls Cases a b Exposed (+) d Not Exposed (-) c Proportions Exposed a/a+c b/(b+d) Proportions Not Exposed c/a+c d/(b+d)
The Odds of Case ExposureThe Odds of Control Exposure Cases Controls a b Exposed (+) c d Not Exposed (-) Odds of case exposure: a/(a+c) = a c/(a+c) c Odds of control exposure: b/(b+d) = b d/(b+d) d
The Odds Ratio in a Case Control Study Odds of case exposure Odds Ratio = Odds of control exposure a/c ad OR = = b/d bc a b c d = cross-product ratio
Case-Control Study of CHD and Smoking Controls CHD Cases 112 176 Smoking (+) 88 224 No Smoking (-) OR = (112 x 224) = 1.62 (88 x 176) The odds that a patient with CHD was exposed to smoking is 1.62 times greater than a patient without CHD.
Interpretation of Odds Ratio Estimates • If OR = 1: Risk in Exposed = Risk in Non-exposed (No Association) • If OR > 1: Risk in Exposed > Risk in Non-exposed (Positive Association) • If OR < 1: Risk in Exposed < Risk in Non-exposed (Protective Association)
Controls Cases a b Exposed (+) c d Not Exposed (-) Another way to look at the Odds Ratio The OR can be viewed as the ratio of the product of the 2 cells that support the hypothesis, cells a and d, (diseased people exposed and non-diseased people unexposed) to the product of the 2 Cells that negate the null hypothesis of association, cells b and c, (exposed non-diseased people and unexposed diseased people)
Case-Control Odds Ratio: An Estimation of Relative Risk • Case- control Odds Ratios can be used to estimate Relative Risk if the following conditions are met: • The controls are representative of the general population • The cases are representative of all cases • The frequency of the disease in the population is small Cases Controls a b c d Exposed Not Exposed ad bc RR= a/(a+b) c/(c+d) a/b c/d If a is small in relation to b = = If c is small in relation to d
A Rare Disease Cases Controls 45 4955 5000 Exposed (+) 29 4971 5000 Not Exposed (-) Relative Risk = (45/5000)/(29/5000) = 1.55 Odds Ratio = (45 x 4971)/(29 x 4955) = 1.56
A Common Disease Cases Controls 4500 500 5000 Exposed (+) 2900 2100 Not Exposed (-) 5000 Relative Risk = (4500/5000)/(2900/5000) = 1.55 Odds Ratio = (4500 x 2100)/(2900 x 500) = 6.52
Problems with Selections of Controls: An Example Using Coffee and Pancreatic Cancer • MacMahan, 1981, case-control study of pancreatic cancer • Cases drawn from 11 Boston and Rhode Island hospitals - histologically confirmed pancreatic cancer • Controls selected from same hospitals, admitted by the same physician as each case • The association between coffee drinking and pancreatic cancer was not the main hypothesis of the study
Odds Ratio in Men Men Pancreatic Cancer Controls 207 275 Coffee drinking 9 32 No coffee OR = (207 x 32)/(275 x 9) = 2.68
Odds Ratio in Women Women Pancreatic Cancer Controls 140 280 Coffee drinking 11 56 No coffee OR = (140 x 56)/(280 x 11) = 2.55
Biased Control Selection • Controls were patients hospitalized at the same time by the same physician who hospitalized the cases • Easier to obtain physician cooperation and control participation • Most admitting physicians were gastroenterlogists • Gastroenterologists were more likely to admit control patients with other GI disorders • Patients with serious GI disorders were less likely to consume coffee
Odds Ratio in Women Women Pancreatic Cancer Controls 140 280 Coffee drinking 11 56 No coffee 1. The percent of controls reporting coffee drinking was less than expected 2. The percent of controls reporting no coffee drinking was greater than expected 3. Controls were not representative of the general population
Recall IssuesCan subjects remember exposure accurately? • Recall Limitations • Subject has incorrect information, forgets, does not have knowledge • Recall Bias • Selective recall by cases • Differential recall between cases and controls
Matching in Case-Control Studies • Purpose: To control for confounding • Confounder: • A known risk factor for your disease of interest • Also associated with your risk factor • Distorts the association between your risk factor and disease • Matching: Selects controls so that they are similar to the cases on confounding variables: age, sex, ses, etc. • Increases statistical precision of estimates allowing smaller sample size
Group Matching Individual Matching Match by frequency or proportion of a selected characteristic Pair-wise matching, each case is paired with a similar control Types of Matching in Case-Control Studies
Group Matching Individual Matching 25% of cases married, controls selected to be 25% married Case is a 45 year old Caucasian woman, control is selected who is also a 45 year old Caucasian woman Examples of Types of Matching
Problems With Matching in Case-Control Studies • Practical • Attempting to match on too many characteristics • Time consuming • Cases who are not successfully matched must be discarded from the analysis • Analytical • When controls are matched to cases on a given characteristic, that characteristic cannot be studied as an independent risk factor for the disease • Do not match on a characteristic you are interested in studying!!
Practical Problems with Matching • Match on age, sex, race, marital status, number of children, zip code • Can you find a control who is a 35 year old Caucasian male, married, 4 children in zip code 92123?
General Guidelines for Matching in Case-Control Studies • Only match on variables that are known risk factors for your disease of interest. • Do not match on variables whose relationship with the disease needs to be studied • Beware of unplanned matching and overmatching
Oral Contraceptives and Cancer: An Example of Unplanned Matching Best-Friend Controls Cancer a b Contraceptive use The % of controls reporting OC use Is likely to be greater than expected c d No contraceptive use Best friends share lifestyle characteristics with cases which will affect any association that is observed
Analysis of a Case-Control Study with Pair-wise Matching Control Exposed Control Not Exposed W X Case exposed Y Z Case not exposed W and Z are concordant pairs, X and Y are discordant pairs OR = X Y
Example of a Case-Control Study with Pair-wise Matching • Antunes, 1979, case-control study of endometrial cancer • Baltimore hospitals: 1973-1977 • Research Question: Is there an association between estrogen use and endometrial cancer? • Selected cases with Stage 1 tumors • Pair-wise matched with controls by hospital, race, and age
Estrogen Use and Endometrial Cancer Control Used Estrogen Control No estrogen 17 76 Case: used estrogen 10 111 Case: no estrogen OR = 76 = 7.6 10
Use of Multiple Controls • Controls of the same type • Controls of different types • Multiple controls per case will increase the statistical power of your study • Up to case-control ratios of approximately 1:4
When to Use Multiple Controls of Different Types? • A single control group may be biased in some way • A hospitalized control group is non-representative of the community • Neighborhood or best-friend controls are overmatched • Can learn more about the disease process
Multiple Controls of Different Types:Prenatal Radiation and Brain Tumors in Children Cases Normal Controls Cancer Controls Children with brain tumors Children with no cancer Children with other types of cancer
Radiation and Brain Tumors Is there recall bias? • Prenatal radiation is a risk factor specifically for brain tumors (not all cancers)