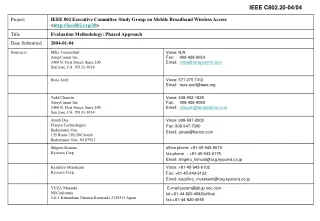
Download
1 / 9
90 likes | 270 Vues
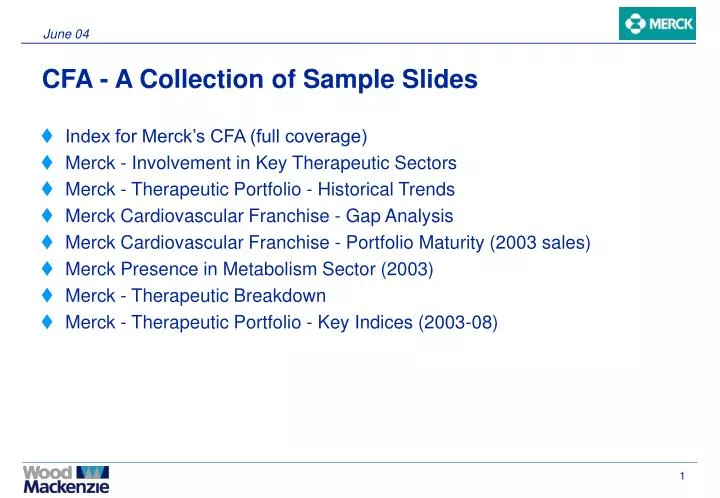
June 04. CFA - A Collection of Sample Slides. Index for Merck’s CFA (full coverage) Merck - Involvement in Key Therapeutic Sectors Merck - Therapeutic Portfolio - Historical Trends Merck Cardiovascular Franchise - Gap Analysis Merck Cardiovascular Franchise - Portfolio Maturity (2003 sales)

E N D
June 04 CFA - A Collection of Sample Slides • Index for Merck’s CFA (full coverage) • Merck - Involvement in Key Therapeutic Sectors • Merck - Therapeutic Portfolio - Historical Trends • Merck Cardiovascular Franchise - Gap Analysis • Merck Cardiovascular Franchise - Portfolio Maturity (2003 sales) • Merck Presence in Metabolism Sector (2003) • Merck - Therapeutic Breakdown • Merck - Therapeutic Portfolio - Key Indices (2003-08)
Index for Merck’s CFA Therapeutic Franchise Sectors Franchise Development & Future Outlook Corporate Assessment • Cardiovasculars • Anti-infectives • Metabolism • Musculoskeletal & Pain • Respiratory • Genito-urinary • Vaccines • Ophthalmology • Peripheral areas • CNS • Emerging areas • Oncology • Strategic Goals & Growth • projections • Business operations • Historical • 2003 • Recent Corporate initiatives • Ranking by sales • Key therapeutic sectors • Therapeutic portfolio • Historical • 2003 • Key therapeutic • franchises • Therapeutic breakdown • Therapeutic portfolio - Key • indices • Franchise market shares • Outlook for Merck’s Pharma • Business WoodMac/CFA/Merck & Co/Index/Jun 04/Page 2
Merck - Involvement in Key Therapeutic Sectors Respiratory Market Leading Franchise Emerging Franchise Areas Secondary Franchise Areas No Presence in Area Ophthalmology (& Sensory Organs) Dermatology Cardiovasculars Genito-urinary CNS GI Musculoskeletal & Pain Anti-infectives Oncology (& support therapies) Metabolism Vaccines Transplant WoodMac/CFA/Merck & Co/Corporate Assessment/Jun 04/Page 9
Merck - Therapeutic Portfolio - Historical Trends…. 1998 - $15.3bn 1995 - $9.9bn Others 3% Cardiovasculars Vaccines 5% 63% Ophthalmology 6% Genito-urinary 4% GI 10% Anti-Infectives 9% Cardiovasculars $8.9bn Anti-infectives $1.4bn Vaccines $0.9bn Metabolism $0.8bn Ophthalmology $0.6bn Genito-urinary $0.4bn Respiratory $0.2bn Others $2.1bn Cardiovasculars $6.2bn Gastro-intestinal $1.0bn Anti-infectives $0.9bn Ophthalmology $0.6bn Vaccines $0.5bn Genito-urinary $0.4bn Others $0.3bn WoodMac/CFA/Merck & Co/Corporate Assessment/Jun 04/Page 10
Merck Cardiovascular Franchise - Gap Analysis WoodMac/CFA/Merck & Co/Cardiovasculars/Jun 04/Page 19
Merck Cardiovascular Franchise - Portfolio Maturity (2003 sales) Prinivil ($116m) Zetia ($235m) Vasotec ($0.8bn) High Zocor ($5bn) Maturity Cozaar ($2.5bn) Demand Decline Growth Low Vytorin Aggrastat ($96m) Launch Time WoodMac/CFA/Merck & Co/Cardiovasculars/Jun 04/Page 21
Merck Presence in Metabolism Sector (2003) Metabolism Market 2003 ($36.6bn) WoodMac/CFA/Merck & Co/Metabolism/Jun 04/Page 39
Merck - Therapeutic Breakdown 2003 - $23.1bn 2008 - $28.7bn Cardiovasculars * $9.2bn Metabolism $5.1bn Respiratory $4.2bn Musculoskeletal & Pain $2.8bn Anti-infectives $1.9bn Vaccines** $1.7bn Ophthalmology $0.8bn CNS $0.5bn Oncology $0.4bn Genito-urinary $0.2bn Other $1.9bn Cardiovasculars * $9.2bn Metabolism $2.7bn Musculoskeletal & Pain $2.6bn Respiratory $2.0bn Vaccines** $1.4bn Anti-infectives $1.3bn Ophthalmology $0.7bn Genito-urinary $0.6bn CNS $0.3bn Other $2.2bn Forecast Compound Growth Rate 2003-08 = 4.5% * includes 50% of Zetia and Vytorin sales through the Merck Schering-Plough alliance ** includes 50%of sales through the AP-MSD European vaccine joint venture WoodMac/CFA/Merck & Co/Future Outlook/Jun 04/Page 115
Merck - Therapeutic Portfolio - Key Indices (2003-08) N.B. Data sourced from Wood Mackenzie’s PharmaQuant Plus - April 2004 The indices in this table relate to Merck’s key global brands only WoodMac/CFA/Merck & Co/Future Outlook/Jun 04/Page 116