Download

1 / 19
200 likes | 311 Vues
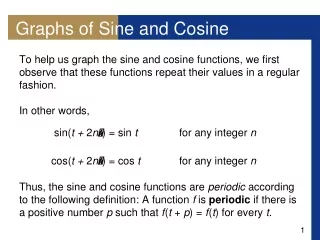
Introduction to Sine Graphs. Warm-up (2:30 m). For the graph below, identify the max, min, y- int , x- int (s), domain and range. Fill in the table below. Then use the points to sketch the graph of y = sin t. π. 2π. Reflection Questions. What is the max of y = sin t? What is the min?

E N D
Warm-up (2:30 m) • For the graph below, identify the max, min, y-int, x-int(s), domain and range.
Fill in the table below. Then use the points to sketch the graph of y = sin t
π • 2π
Reflection Questions • What is the max of y = sin t? What is the min? • What is the y-int? What are the x-intercepts? • What is the domain? What is the range?
Reflection Questions, cont. • What do you think would happen if you extended the graph beyond 2π? • How would extending the graph affect the domain and the x-intercepts?
Periodicity Period: π 2 • Trigonometric graphs are periodic because the pattern of the graph repeats itself • How long it takes the graph to complete one full wave is called the period 2π π 0 1 Period 1 Period –2
Periodicity, cont. 2 2 π –2π 2π –π –2 –2
Your Turn: • Complete problems 1 – 3 in the guided notes.
1. f(t) = –3sin(t) 2. 3. f(t) = sin(5t)
Calculating Periodicity • If f(t) = sin(bt), then period = • Period is always positive 4. f(t) = sin(–6t) 5. 6.
Your Turn: • Calculate the period of the following graphs: • f(t) = sin(3t) 8. f(t) = sin(–4t) 9. 10. f(t) = 4sin(2t) 11. 12.
Amplitude f(t) = 3sin(t) + 1 • Amplitude is a trigonometric graph’s greatest distance from the middle line. (The amplitude is half the height.) • Amplitude is always positive. • If f(t) = a sin(t), then amplitude = | a |
Calculating Amplitude Examples 17. f(t) = 6sin(4t) 18. f(t) = –5sin(6t) 19. 20.
Your Turn: • Complete problems 21 – 26 in the guided notes
21. f(t) = –2sin(t) + 1 22. f(t) = sin(2t) + 4