Download
1 / 45
480 likes | 605 Vues
The Electrooculogram EOG. Faezeh heydari 86133102. EOG.

E N D
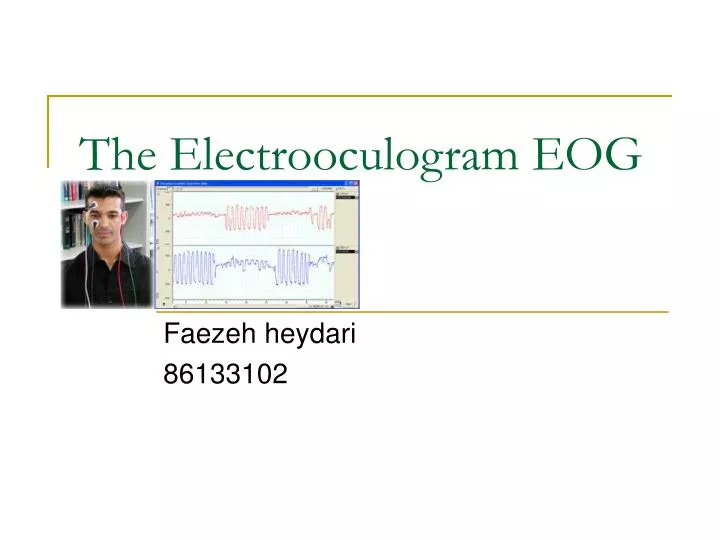
The Electrooculogram EOG Faezeh heydari 86133102
EOG The clinical electrooculogram is an electrophisiological test of function of the outer retina and retinal pigment epithelium in which the change in the electrical potential between the cornea and the ocular fundus is recorded during successive periods of dark and light adaptation. Today the recording of the EOG is a routinely applied diagnostic method in investigating the human oculomotor system. The application of digital computers has considerably increased the diagnostic power of this method .
Electrophisiology of RPE in dark and light adaptation Emil du Bois-Reymond (1848) observed that the cornea of the eye is electrically positive relative to the back of the eye. Elwin Marg named the electrooculogram in 1951 and Geoffrey Arden (Arden et al. 1962) developed the first clinical application.
EOG This positive potential behaves as if it were a single dipole oriented from the retina to the cornea. Such corneoretinal potentials are well established and are in the range of 0.4 - 1.0 mV . Eye movements thus produce a moving (rotating) dipole source and, accordingly, signals that are a measure of the movement may be obtained . The chief application of the EOG is in the measurement of eye movement.
Measuremant of the clinical EOG The calibration of the signal may be achieved by having the patient look consecutively at two different fixation points located a known angle apart and recording the concomitant EOGs . By attaching skin electrodes on both sides of an eye the potential can be measured by having the subject move his or her eyes horizontally a set distance . Typical signal magnitudes range from 5-20 µV/°.
Measuremant of the clinical EOG A ground electrode is attached usually to either the forehead or earlobe. Either inside a Ganzfeld, or on a screen in front of the patient, small red fixation lights are place 30 degrees apart . The distance the lights are separated is not critical for routine testing.
Saccadic Response Saccadic movements describe quick jumps of the eye from one fixation point to another. The speed may be 20 - 700°/s.
Saccadic Response The trajectory and velocity of saccades cannot voluntarily be altered. Typical values of these parameters are 400°/s for the maximum velocity, 20° for the amplitude, 80 ms for the duration, and 200 ms for the latency . When making large saccades (>25°), the eyes reach the maximum velocity earlier, and then have a prolonged deceleration. Normally the duration and amplitude are approximately linearly correlated to each other. Several factors such as fatigue, diseases, drugs, and alcohol influence saccades as well as other eye movements.
Nystagmography Nystagmography refers to the behavior of the visual control system when both vestibular (balance) and visual stimuli exist. Nystagmoid movement is applied to a general class of unstable eye movements, and includes both smooth and saccadic contributions. Based on the origin of the nystagmoid movement, it is possible to separate it into vestibular and optokinetic nystagmus. Despite their different physiological origin, these signals do not differ largely from each other.
Vestibular Nystagmus Nystagmography is a useful tool in the clinical investigation of the vestibular system . The vestibular system senses head motion from the signals generated by receptors located in the labyrinths of the inner ear. Inappropriate compensatory eye movements can easily be recognized by the trained clinician. Such an examination must be made in the absence of visual fixation (since the latter suppresses vestibular eye movements) and is usually carried out in darkness or with the patient's eye closed. Consequently, monitoring eye movement by EOG is the method of choice.
Optokinetic Nystagmus Another example of nystagmoid movement is where the subject is stationary but the target is in rapid motion. The oculomotor system endeavors to keep the image of the target focused at the retinal fovea.
The standard mehtod The patient should be light adapted such as in an well-illuminated room, and their eyes dilated. After the electrodes are attached the procedure is explained and the patient asked to practice several times while baseline data are recorded.
The standard mehtod The procedure is simply that the patient keeps his or her head still while moving the eyes back and forth alternating between the two red lights. The movement of the eyes produces a voltage swing of approximately 5 millivolts between the electrodes on each side of the eye, which is charted on graph paper or stored in the memory of a computer.
The standard mehtod After training the patient in the eye movements, the lights are turned off. About every minute a sample of eye movement is taken as the patient is asked to look back and forth between the two lights . Some laboratories have the patients move their eyes the entire testing period. After 15 minutes the lights are turned on and the patient is again asked about once a minute to move his or her eyes back and forth for about 10 seconds.
The standard mehtod Typically the voltage becomes a little smaller in the dark reaching its lowest potential after about 8-12 minutes, the so-called "dark trough.“ When the lights are turned on the potential rises, the light rise, reaching its peak in about 10 minutes. When the size of the "light peak" is compared to the "dark trough" the relative size should be about 2:1 or greater . A light/dark ratio of less than about 1.7 is considered abnormal.
BEST Disease Sight loss can be variable but, like other macular problems, Best's disease threatens central vision in one or both eyes. Within 5 identifiable stages, examination of the eye discloses a distinct progression. At first and second stages, there may be little or no effect on sight.
BEST Disease • Initially a recording of eye movements and eye position identifies abnormal electrical potential. • At the second stage (usually between 10-25 years of age), typical yellow spots, sometimes accompanied by material leaking into a space by the retina, can be observed; an observation called "egg-yolk" lesion. • When part of the lesion becomes absorbed this is identified as stage three. • At the fourth stage, when the "egg-yolk" breaks up, in a process referred to as "scrambled-egg", sight will probably be affected. • The fifth and final stage is when the condition causes the most severe sight loss.
diseases • the curves of the EOG of the depressed patients have lower amplitude. • The normalised mean EOG amplitudes obtained from a group of amblyopic eyes were significantly lower that the normalised mean amplitudes from the fellow eyes at all time points during the EOG recording.
Practical notes, instruments and definitions • Amplifiers: for the lowpass filter, 30 Hz is sufficient. • Amplifier saturation: EOG potentails measured during saccadic eye movements can vary by about 5:1 in amplitude between subjects, which, with the light rise, may mean a total amplitude range of up to 15:1. thus, the operator must be able to see the rocordings of the saccades to ensure saturation dose not occur, and to adjust the amplifier gain setting accordingly.
Practical notes, instruments and definitions • Arden ratio: the Arden ratio is the peak EOG amplitude occurring in the light phase, divided by the minimum amplitude during the dark phase. • Compliance of the patient: some patient suffer claustrophobia or fear of the dark, and so the testing must be perform in such a way as to minimise these fears. In most cases, coaching under observation can remedy poor co-operation.
Practical notes, instruments and definitions • Electrodes: recording the EOG is relatively undemanding as regards the electrodes. These shoud be relatively non-polarisable such as standard medical EEG or ECG electrodes, of a size appropriate for attachment to the side of the nose. • Full field (Ganzfield) stimulator: this should be as large as practicable to allow adequate distance from eye to fixation lights. It should have a chin rest and forehead bar to ensure stable head position.
Practical notes, instruments and definitions • Plotting: the average EOG amplitude calculated from each 10 second trial shoud be potted. It is helpful if any uncertain values have been identified and marked at the time of recording, so that they can be ignored when identifying the underlying curve. • Pupil dilation: having dilated pupils means less variability in the light entering the eye. If pupils are not artificially dilated, then the report should state this.
Light • Luminance: the calibration of the ganzfield stimulator shoud be carried out periodically, once ayear, and corrective action applied. • Colour: there are several possible sources of adapting light such as tungsten, halogen, LED and fluorescent. For a commercial recording system, the type will be stated in manufacturer’s literature.
Reporting • Basic factual report: this should include the Arden ratio, the first dark trough amplitude, the time from the start of the light phase to the light peak, the pupil size at the end of the test, and the type of the adapting light source. • Saccade measurement: use a scale to measure the change in EOG potential resulting from each saccade, and calculate an average for each 10 second trial. the average should include only those measurements judged to be reiable.
Reporting • Standing potentials: reporting of the minimum standing potential, taken from the underlying response curve, not the minimum recorded value. This value is not often used in diagnosis at present, but if the value is abnormally low it may indicate an inactive retina. and the calculated Arden ratio may be unreliable beacause of the low value of the divisor in the ratio. • warning of start of each trial: there shoud be a warning, verbal or automatic, of the impeding start of each trail, to ensure readiness of both test subject and operator.
EOG The EOG is redundant with the ERG in most retinal disorders. Retinal diseases producing an abnormal EOG will usually have an abnormal ERG which is the better test for analysis of scotopic and photopic measures. The most common use of the EOG is to confirm Best's disease.
EOG The most important disadvantages relate to the fact that the corneoretinal potential is not fixed but has been found to vary diurnally, and to be affected by light, fatigue, and other qualities. Consequently, there is a need for frequent calibration and recalibration. Additional difficulties arise owing to muscle artifacts and the basic nonlinearity of the method.
EOG The advantages of this technique include recording with minimal interference with subject activities and minimal discomfort . The EOG had advantages over the ERG in that electrodes did not touch the surface of the eye.
The electroretinogram ERG The global or full-field electroretinogram (ERG) is a mass electrical response of the retina to photic stimulation. The intense flash of light elicits a biphasic waveform recordable at the cornea.
ERG Two principal measures of the ERG waveform are taken: 1) The amplitude (a) from the baseline to the negative trough of the a-wave, and the amplitude of the b-wave measured from the trough of the a-wave to the following peak of the b-wave; and 2) the time (t) from flash onset to the trough of the a-wave and the time (t) from flash onset to the peak of the b-wave .
ERG recording electrodes There are a number of corneal ERG electrodes that are in common use. Some are speculum structures that hold the eye open and have a contact lens with a wire ring that "floats" on the cornea supported by a small spring . Some versions use carbon, wire or gold foil to record electrical activity.