Download
1 / 41
410 likes | 532 Vues
BASIC STATISTICS: AN OXYMORON? (With a little EPI thrown in…). URVASHI VAID MD, MS AUG 2012. OUTLINE. Definition Why do we need to know “statistics”? Validity- external and internal Reliability Sensitivity Specificity Positive and negative predictive values ROC curves. STATISTICS.

E N D
BASIC STATISTICS:AN OXYMORON?(With a little EPI thrown in…) URVASHI VAID MD, MS AUG 2012
OUTLINE • Definition • Why do we need to know “statistics”? • Validity- external and internal • Reliability • Sensitivity • Specificity • Positive and negative predictive values • ROC curves
STATISTICS • “the science that deals with the collection, classification, analysis, and interpretation of numerical facts or data, and that, by use of mathematical theories of probability, imposes order and regularity on aggregates of more or less disparate elements”
BUT WHY? • To effectively conduct research • To read and evaluate journals • To develop critical and analytical thinking • To be an informed consumer • To know your limits
Population Sampling Inference Sample Treatment group A vs Treatment group B
POPULATION Target Population Eg smokers Study Population (eligible) Eg Ages 55-74 yrs, ≥ 30 pack years Study Sample (enrolled) Eggeographic area, site, consent Target Population Study Population Study Sample
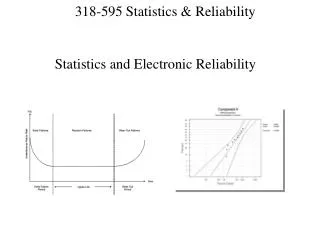
Measures of dispersion • Range • Standard deviation- Bell’s curve • Others
GENERALIZABILITY • Also “External Validity” • how representative of the target population is the study population and study sample? • Based on inclusion/exclusion criteria and standard of care • Where • When • Who (subjects) • What (treatments, outcomes) • How (assessments, data collection)
INTERNAL VALIDITY or no “bias” • Estimated effect in study sample is accurate reflection of true effect in underlying study population • Can be in jeopardy due “Systematic Error” • Selection or allocation bias • Information or recall bias or treatment related bias • Confounding • Cross over or lost to follow up • Deal with this by creating a good study design and statistics • Also- randomize, blind, quality control, adjust for co-variates
RANDOMIZATION • Balances groups on known and unknown risk factors in the long run • Provides statistical basis for estimation and testing • Effort, time, cost • Ethics – patient wants “best” treatment – physician wants to tailor treatment to individual patient • Clinical Equipoise?
HYPOTHESIS TESTING • H0: Null Hypothesis--There is no association between an exposure and outcome • H1: Alternative Hypothesis--There is an association between an exposure and outcome • In general, epidemiologists attempt to reject the null • One-sided (higher or lower) vs two-sided (different)
TRUTH D E C I S I O N
Type I error (false positive, α) probability of rejecting null hypothesis, when it is true • Type II error (false negative, β) probability of not rejecting null hypothesis, when it is false • Power (1-β) probability of rejecting null hypothesis, when it is false
POWER AND SAMPLE SIZE • Ensure study worth doing and feasible • Have to consider • study design • outcome (distribution, variability, etc.) • hypothesis to be tested (superiority, equivalence, etc.) • statistical analysis to be performed • clinically relevant/meaningful effect size to be detected • Larger the effect size, smaller the sample size needed • More subjects more power!
SENSITIVITY • A test’s ability to identify diseased individuals • Probability of a positive test among those with disease
SPECIFICITY • A test’s ability to rule out disease • Probability of a negative test among those without disease
Sensitivity and Specificity are fixed aspects of a testDo not change based on disease prevalence
Sensitivity = True Positive /Those with disease = TP/(TP+FN) Specificity = True Negative/Those without disease = TN/(TN+FP)
EXAMPLE • 200 patients • D-dimer positive in 50 • CT angio positive in 60 • CT angio and d-dimer negative in 120 • Construct a 2 X 2 table and calculate sensitivity and specificity.
Sensitivity= TP/TP+FN= 30/30+30=50% Specificity= TN/TN+FP= 120/120+20= 85%
POSITIVE PREDICTIVE VALUE • The probability of having disease given a positive test: P(D+|T+) • ‘How likely is it that this patient has the disease given that the test result is positive?’ • Calculated as: (TRUE POSITIVE)/(TRUE POSITIVE + FALSE POSITIVE) • Sensitivity is the probability of test positive given disease: P(T+|D+)
NEGATIVE PREDICTIVE VALUE • The probability of not having disease given a negative test: P(D-|T-) • ‘How likely is it that this patient does not have the disease given that the test result is negative?’ • Calculated as: (TRUE NEGATIVE)/(TRUE NEGATIVE + FALSE NEGATIVE) • Specificity is the probability of testing negative given no disease: P(T-|D-)
Sensitivity and specificity are characteristics of tests themselves • Predictive values (positive and negative) are functions of both test characteristics and prevalence
EFFECT OF PREVALENCE • 4000 people, of which 2000 are ill and 2000 well • A screening test with 99% sensitivity and 99% specificity will yield 1980 TP and 1980 TN and only 20 each for FP and FN • Hence PPV is 99%. • What if the number of ill people is only 200? • Then well people are 3800 and FP increase to 38 and PPV falls to 84%
ROC • Receiver operator characteristic curves are a plot of false positives against true positives for all cut-off values • The area under the curve of a perfect test is 1.0 and that of a useless test, no better than tossing a coin, is 0.5