Download
1 / 20
200 likes | 290 Vues
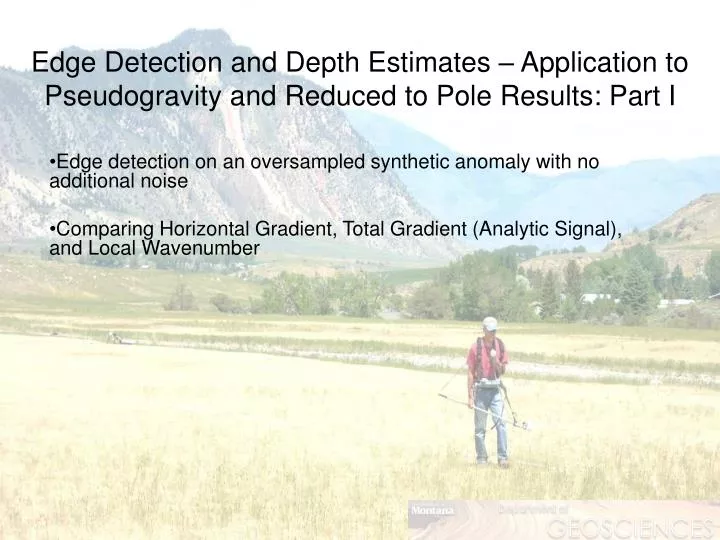
Edge Detection and Depth Estimates – Application to Pseudogravity and Reduced to Pole Results: Part I. Edge detection on an oversampled synthetic anomaly with no additional noise Comparing Horizontal Gradient, Total Gradient (Analytic Signal), and Local Wavenumber.

E N D
Edge Detection and Depth Estimates – Application to Pseudogravity and Reduced to Pole Results: Part I Edge detection on an oversampled synthetic anomaly with no additional noise Comparing Horizontal Gradient, Total Gradient (Analytic Signal), and Local Wavenumber
Magnetic anomaly calculated for 1.5 meters above the ground surface. Dimensions are kilometers, sampling interval is 400 meters, contour interval is 10 nT, inclination = 68o. • Subsurface model: • Minimum depth is 250 meters, maximum is 3.35 kilometers • Magnetic susceptibility is constant and positive with no remanent magnetization
The Model from Different Perspectives • East-west faults get deeper and have less throw along strike from the center as they traverse from edge to edge of the model area • The north-south fault gets deeper to the south but the throw is constant • The long wavelength shape is that of a truncated dome.
Total field anomaly;inclination = 68o Reduced to pole anomaly
Reduced to pole anomaly (RTP) Horizontal Gradient of the RTP anomaly
Maxima of the Horizontal Gradient of the RTP anomaly Maxima of the Horizontal Gradient of the RTP anomaly overlain on the source model
Reduced to pole anomaly (RTP) Total Gradient (Analytic Signal) of the RTP anomaly
Maxima of the Total Gradient of the RTP anomaly overlain on the source model Maxima of the Total Gradient of the RTP anomaly
Reduced to pole anomaly (RTP) Local Wavenumber of the RTP anomaly
Maxima of the Local Wavenumber of the RTP anomaly Maxima of the Local Wavenumber of the RTP anomaly overlain on the source model
Total field anomaly (inc = 68o) Pseudogravity (Vertical Integral of RTP)
Pseudogravity Horizontal Gradient of the Pseudogravity
Maxima of the Horizontal Gradient of the Pseudogravity Maxima of the Horizontal Gradient of the Pseudogravity overlain on the source model
Total Gradient (Analytic Signal) of the Pseudogravity Pseudogravity
Maxima of the Total Gradient of the Pseudogravity Maxima of the Total Gradient of the Pseudogravity overlain on the source model
Pseudogravity Local Wavenumber of the Pseudogravity
Maxima of the Local Wavenumber of the Pseudogravity Maxima of the Local Wavenumber of the Pseudogravity overlain on the source model
The Model from Different Perspectives • East-west faults get deeper and have less throw along strike from the center but go from edge to edge of the model area • The north-south fault gets deeper to the south but the throw is constant • The long wavelength shape is that of a truncated dome.
All Maxima; Analysis on Pseudogravity All Maxima; Analysis on RTP • Maxima from the methods: Blue = HGM; Green = AS; Magenta = LWN • For each case, operating on the pseudogravity (vertical integration of RTP) results in fewer spurious results; vertical integration is a low-pass operator. • East-west faults run edge to edge and get deeper away from the center; only the LWN maxima trace faults continuously to the edges on both PSG and RTP. • Only HGM on PSG gives insight into the curved nature of the main dome.
Top Four Quintiles of Gradient Maxima From the Pseudogravity Classed post map of the four upper quintiles of the combined results of HGM, AS, and LWN analysis of the pseudogravity (purple, blue, green, and red in order of increasing significance).