Download
1 / 19
190 likes | 360 Vues
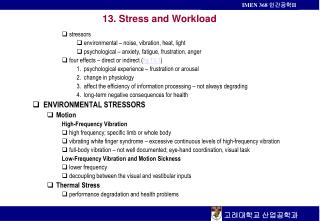
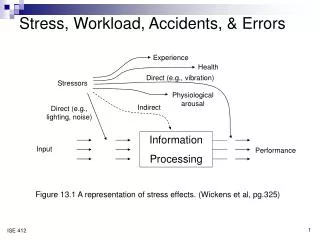
13. Stress and Workload. Figure 13.1 A representation of stress effects. ENVIRONMENTAL STRESSORS. Motion High-frequency Vibration Low-Frequency Vibration and Motion Sickness Thermal Stress Air Quality. PSYCHOLOGICAL STRESSORS. Cognitive Appraisal Ethical Issues. Level of Arousal.

E N D
Motion • High-frequency Vibration • Low-Frequency Vibration and Motion Sickness • Thermal Stress • Air Quality
Cognitive Appraisal • EthicalIssues
Level of Arousal Figure 13.2 The Yerkes-Dodson law showing the relationship between level of arousal (induced by stress) and performance. The OLA is shown to be higher for less complex tasks.
Performance Changes with Overarousal • Remediation of Psychological Stress
Workload • The timeline model Figure 13.3 Timeline analysis. The percentage of workload at each point is computed as the average number of tasks per unit time, within each window. Shown at the bottom of the figure is the computed workload value TR/TA.
Mental Workload Measurement • Primary task measures • Secondary task methods • Physiological measures • Subjective measures • Workload dissociations
Vigilance and Underarousal • Causes of the vigilance decrement • Time • Event salience • Signal rate • Arousal level • Vigilance remediation
Sleep Disruption • Sleep Deprivation and Performance Effects • Circadian Rhythms
Figure 13.5 Graph plotting mean sleep latency (top), circadian rhythms (body temperature), and sleep duration (Bottom) against time for two day-night cycles. The bars around sleep duration represent the variability.
Circadian Disruption • Jet lag • Shift work • Remediation to Sleep disruption
Figure 13.6 Graph showing how performance on four kinds of tasks varies as a function of circadian rhythms, shown for a one day cycle.