Download
1 / 1
10 likes | 112 Vues
QSAR and Chemometric Approaches for the Assessment of Water Quality. M. Vighi 1a , P. Gramatica 2 , F. Consolaro 2 and R. Todeschini 1b

E N D
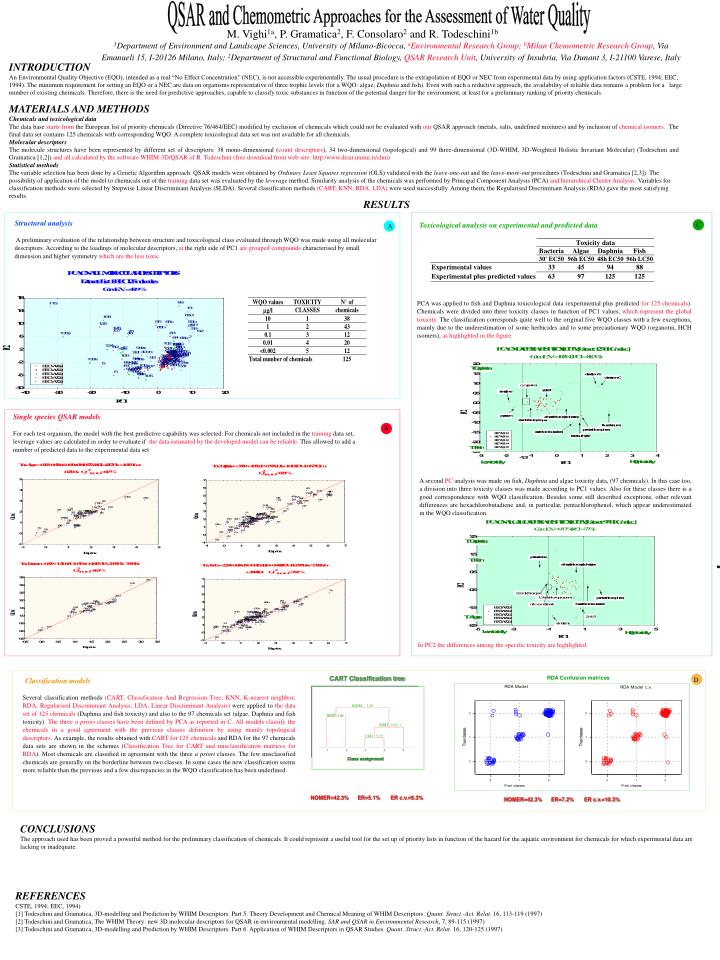
QSAR and Chemometric Approaches for the Assessment of Water Quality • M. Vighi1a, P. Gramatica2, F. Consolaro2 and R. Todeschini1b • 1Department of Environment and Landscape Sciences, University of Milano-Bicocca, aEnvironmental Research Group; bMilan ChemometricResearch Group, Via Emanueli 15, I-20126 Milano, Italy; 2Department of Structural and Functional Biology, QSAR Research Unit, University ofInsubria, Via Dunant 3, I-21100 Varese, Italy INTRODUCTION An Environmental Quality Objective (EQO), intended as a real “No Effect Concentration” (NEC), is not accessible experimentally. The usual procedure is the extrapolation of EQO or NEC from experimental data by using application factors (CSTE, 1994; EEC, 1994). The minimum requirement for setting an EQO or a NEC are data on organisms representative of three trophic levels (for a WQO: algae, Daphnia and fish). Even with such a reductive approach, the availability of reliable data remains a problem for a large number of existing chemicals. Therefore, there is the need for predictive approaches, capable to classify toxic substances in function of the potential danger for the environment, at least for a preliminary ranking of priority chemicals. MATERIALS AND METHODS Chemicals and toxicological data The data base starts from the European list of priority chemicals (Directive 76/464/EEC) modified by exclusion of chemicals which could not be evaluated with our QSAR approach (metals, salts, undefined mixtures) and by inclusion of chemical isomers. The final data set contains 125 chemicals with corresponding WQO. A complete toxicological data set was not available for all chemicals. Molecular descriptors The molecule structures have been represented by different set of descriptors: 38 mono-dimensional (count descriptors), 34 two-dimensional (topological) and 99 three-dimensional (3D-WHIM, 3D-Weighted Holistic Invariant Molecular) (Todeschini and Gramatica [1,2]) and all calculated by the software WHIM-3D/QSAR of R. Todeschini (free download from web-site: http:/www.disat.unimi.it/chm) Statistical methods The variable selection has been done by a Genetic Algorithm approach. QSAR models were obtained by Ordinary Least Squares regression (OLS) validated with the leave-one-out and the leave-more-out procedures (Todeschiniand Gramatica [2,3]). The possibility of application of the model to chemicals out of the training data set was evaluated by the leverage method. Similarity analysis of the chemicals was performed by Principal Component Analysis (PCA) and hierarchical Cluster Analysis. Variables for classification methods were selected by Stepwise Linear Discriminant Analysis (SLDA). Several classification methods (CART, KNN, RDA, LDA) were used successfully. Among them, the Regularised Discriminant Analysis (RDA) gave the most satisfying results. RESULTS • Toxicological analysis on experimental and predicted data • PCA was applied to fish and Daphnia toxicological data (experimental plus predicted for 125 chemicals). Chemicals were divided into three toxicity classes in function of PC1 values, which represent the global toxicity. The classification corresponds quite well to the original five WQO classes with a few exceptions, mainly due to the underestimation of some herbicides and to some precautionary WQO (organotin, HCH isomers), as highlighted in the figure. • A second PC analysis was made on fish, Daphnia and algae toxicity data, (97 chemicals). In this case too, a division into three toxicity classes was made according to PC1 values. Also for these classes there is a good correspondence with WQO classification. Besides some still described exceptions, other relevant differences are hexachlorobutadiene and, in particular, pentachlorophenol, which appear underestimated in the WQO classification. Structural analysis A preliminary evaluation of the relationship between structure and toxicological class evaluated through WQO was made using all molecular descriptors. According to the loadings of molecular descriptors, at the right side of PC1 are grouped compounds characterised by small dimension and higher symmetry which are the less toxic. C A Single species QSAR models For each test organism, the model with the best predictive capability was selected. For chemicals not included in the training data set, leverage values are calculated in order to evaluate if the data estimated bythe developed model can be reliable. This allowed to add a number of predicted data to the experimental data set B In PC2 the differences among the specific toxicity are highlighted. CART Classification tree RDA Confusion matrices D • Classification models • Several classification methods (CART, Classification And Regression Tree; KNN, K-nearest neighbor; RDA, Regularised Discriminant Analysis, LDA, Linear Discriminant Analysis) were applied to the data set of 125 chemicals (Daphnia and fish toxicity) and also to the 97 chemicals set (algae, Daphnia and fish toxicity). The three a priori classes have been defined by PCA as reported in C. All models classify the chemicals in a good agreement with the previous classes definition by using mainly topological descriptors. As example, the results obtained with CART for 125 chemicals and RDA for the 97 chemicals data sets are shown in the schemes (Classification Tree for CART and misclassification matrices for RDA). Most chemicals are classified in agreement with the three a priori classes. The few misclassified chemicals are generally on the borderline between two classes. In some cases the new classification seems more reliable than the previous and a few discrepancies in the WQO classification has been underlined. IDDM 3.56 . IDMT 106 IDMT 2052.3 . CHI1 5.72 1 2 3 2 3 Class assignment NOMER=42.3% ER=5.1% ER c.v.=9.3% NOMER=42.3% ER=7.2% ER c.v.=10.3% CONCLUSIONS The approach used has been proved a powerful method for the preliminary classification of chemicals. It could represent a useful tool for the set up of priority lists in function of the hazard for the aquatic environment for chemicals for which experimental data are lacking or inadequate. REFERENCES CSTE, 1994; EEC, 1994) [1] Todeschini and Gramatica, 3D-modelling and Prediction by WHIM Descriptors. Part 5. Theory Development and Chemical Meaning of WHIM Descriptors. Quant. Struct.-Act. Relat. 16, 113-119 (1997) [2] Todeschini and Gramatica, The WHIM Theory: new 3D molecular descriptors for QSAR in environmental modelling. SAR and QSAR in Environmental Research, 7, 89-115 (1997) [3] Todeschini and Gramatica, 3D-modelling and Prediction by WHIM Descriptors. Part 6. Application of WHIM Descriptors in QSAR Studies. Quant. Struct.-Act. Relat. 16, 120-125 (1997)