Download
1 / 38
390 likes | 516 Vues
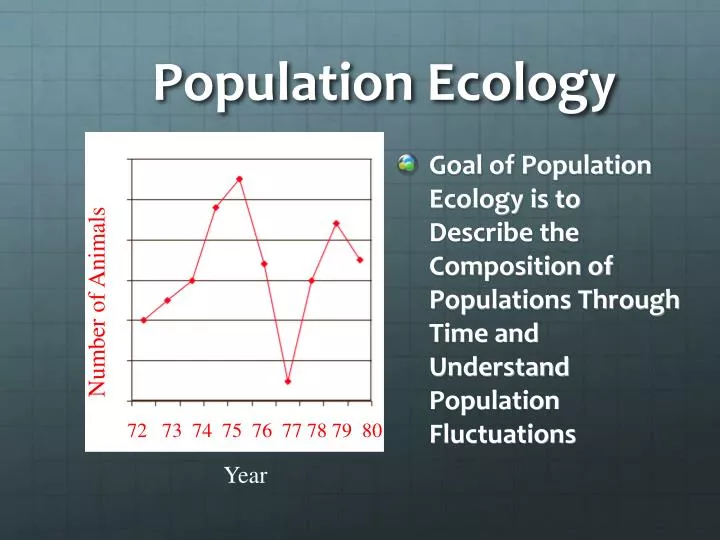
Population Ecology. Goal of Population Ecology is to Describe the Composition of Populations Through Time and Understand Population Fluctuations. Number of Animals. 72 73 74 75 76 77 78 79 80. Year. Describing Population Composition. Sex Ratio Age Ratio Genetic Composition

E N D
Population Ecology • Goal of Population Ecology is to Describe the Composition of Populations Through Time and Understand Population Fluctuations Number of Animals 72 73 74 75 76 77 78 79 80 Year
Describing Population Composition • Sex Ratio • Age Ratio • Genetic Composition • Spatial Structuring
Sex Ratio Indicates Important Processes in Population • Population growth potential--greater male bias = less growth ability (sexual species) • Breeding System • Dispersal • (Data from Marzluff and Balda 1992) Sex Ratio (Males:Females) in Flock of Pinyon Jays 72 73 74 75 76 77 78 79 80
Age Pyramids Summarize Age Structure • Differ for Increasing, Steady, and Declining Populations • Indicate Bad Years, Bottlenecks in Reproduction, etc. Proportion in each age class Increasing Population Stable Population Declining Population
Pinyon Jays Were Studied for 20 Years • Long-term studies of marked animals are needed to get accurate population growth and composition information.
Age Structure Reflects Relative Productivity of Cohorts • Young (cohort) from productive years constitute large proportion of population for many years (1977, 1978) • A poor year of reproduction continues to be echoed in population as a missing cohort (1976) 300 1978 1977 Number of Jays in Flock 1976 50 73 74 75 76 77 78 79 80 81 82 YEAR (Marzluff & Balda 1992)
Importance of Indirect and Direct Selection Depends on Genetic Composition of Population Number of Relatives in Flock Age of Focal Individual (Marzluff & Balda 1992)
Describing Change in Population Size • Managers are usually concerned with monitoring population SIZE---So, How do WE Quantify CHANGE in Population Size?? (Lack 1966) Density of Great Tits in 4 Areas Year
Population size and rates of growth Population size: Nt = population size at time t Nt+1 = population size at time t+1 Nt+1 =Nt + Births + Immigration – Deaths -Emigration Growth rates: r = exponential growth rate λ (‘lambda’) = intrinsic population growth rate
Population growth Reproduction, births, natality (B) Emigration (E) Immigration (I) Population Mortality, death (D) “BIDE”
Age-specific birth rates A fecundity schedule for Chamois from New Zealand. Age (yrs) N # Female births per pregnant female _____________________________________________ 0 - - 0.000 1 60 2 0.017 2 36 14 0.194 3 70 52 0.371 4 48 45 0.469 5 26 19 0.365 6 19 16 0.421 7 6 5 0.417 >7 10 7 0.350 ___________________________________________
Survivorship curves for male & female moose on Isle Royale females Survivors (lx) males 2 4 6 8 10 12 14 16 18 20 Age at Death (years)
Emigration and Immigration • Juvenile dispersal: movement from place of birth to place of breeding • Breeding dispersal: movement by adults from one place of breeding to another • Birds: Female dispersing sex • Mammals: Male dispersing sex
Population Growth Carrying capacity (k) Exponential k N N Logistic time time Classic growth curve, unlimited resources Classic growth curve, limited resources (k)
The Simplest Quantification of Population Growth Assumes Exponential Growth • Nt=N0ert-----let t = 1 year • N1=N0er • er=N1/N0===Lambda, Finite rate of Increase • Lambda goes from 0 (extinction) to 1 (stable growth) to positive infinity (Exponential growth of various magnitude)
Exponent Indicates the Magnitude of Change • er=N2/N1---Take ln (natural log, loge) of both sides to get: • r = ln(N2/N1) • varies from negative infinity (decrease) to 0 (Stable) to positive infinity (increase) • r, the exponential multiplier, = Intrinsic (instantaneous) rate of increase
Exponents provide consistent quantification of magnitude of change • Doubling and halving of population produces same exponent multiplier of change----sign of multiplier changes • N1=50 ---N2=100--doubling • er = (lamda) = 100/50 = 2 • r = ln (2) = .693 • N1=100--N2=50---halving • er = (lamda) = 50/100 = 0.5 • r = ln (0.5) = -.693
Units of r and lambda • Units of lambda are obvious • numbers per unit time • restricted to the unit it was calculated over • t = 1 year, then rate is change per year • Units of r not obvious • it is a multiplier, not a rate • “growth multiplier of ln(#s) per unit time” • not restricted to unit it was calculated over • r from 1 year can be transformed to r for each day by dividing by 365, etc.
Lambda and r • Both present the same information in varying formats • Population increases at lambda per unit time or r at any instant in time • r is useful because it can be transformed to fit time interval of interest, lambda is more intuitive
Unlimited Growth • Australian rabbit (European hare) • 1859: 24 hares introduced (for human food?) • 1865: over 20,000 hares were harvested, actual • population much greater. • Mid-1800’s to mid-1900’s: major problem with too • many hares; caused habitat destruction and • reduction in native mammals • 2000: still present, local problems
Carrying capacity Rabbits exceeded k No rabbits Rabbit-proof fence
Carrying capacity Carrying capacity (k):the number of organisms that can be supported by a given area; the actual number of organisms fluctuates near this # of Animals (N) k time
Adding A Limit to Population Growth • More Realistic than Exponential Growth • Growth is adjusted as population approaches carrying capacity (K) of the environment • Population growth simply stops at K • Population crashes after resource is consumed • Population growth is under negative feedback as it approaches K and gradually reaches K
Population Growth is Gradually Reduced as Carrying Capacity is Reached; Resources Renew Independently of Population Size Inflection Point • Logistic Growth • simple favorite in wildlife management • Rate of Increase is only a function of Population Density • Assumes resources are not damaged by large populations • Wildebeast don’t affect grass roots K #s Ln (#s) Time
Logistic Math • Verhulst (1838) and Pearl & Reed (1920) independently derived equation • Verhulst-Pearl Equation (Sigmoidal Growth) • dN/dt = derivative form of change in N with respect to time • dN/dt = rmN(1-N/K) • dN/dt = rmN = exponential growth • As N approaches K, N/K approaches 1. Therefore rmN(1-N/K) approaches 0
With K and Typical Seasonal Patterns of Reproduction, There is Often A “Doomed Surplus” • Mink control distribution of muskrats • those in poor sites including dispersers are eaten • Predators often take the young, homeless, sick, injured, dispersing, or old individuals • so effect on species or community is less Poor Sites Good Sites High Pops Density of Muskrats Low Pops Deep Water Dry Upland (Errington 1946)
Logistic Growth Model May be Used to Calculate Harvest • Maximum Sustainable Yield is at Inflection Point • Growth is Maximum and Population is at Largest Size • Larger Populations Start to Have Slower Growth K Maximum Yield =1/2 K #s Ln (#s) Time
Another View of Logistic Growth • Growth rate starts slow, peaks, and ends slow • Maximum Sustainable Yield is at rate of fastest population growth Inflection Point Max Sustainable Yield dN/dt K N
Assumptions of Logistic Growth • All individuals contribute equally to population growth--equal reproduction regardless of age or sex • Growth rate is constant regardless of environmental variation • K is constant--not affected by growth • Reduction in growth as population approaches K is linear and instantaneous (no time lags)
Populations fluctuate due to • Density dependent factors • Ex: Predation, competition, habitat availability • change population growth in predictable ways • N is driven by population density • Density independent factors • Random or Stochastic events • Ex. Weather, accidents • Breeding 14 aug 2007
Reindeer (caribou) # young produced Bighorn sheep Population density (top) or size (bottom)
Population regulation: food High food addition Low food addition Townsend’s vole No food added Shaded area is winter
Population regulation: food Population cycles: Ex. peaks in lynx populations show time lag behind peaks in snowshoe hare populations Snowshoe hare Population size Lynx Time (years)
Population regulation: competition • Competition – demand by 2 or more individuals of the same or different species for a common resource • Between 2 individuals of same species: Intraspecific • Between 2 individuals of different species: Interspecific • Limited supply of resource: Exploitation • Not limited but interaction detrimental: Interference
Inter- or Intraspecific competition?Exploitation or Interference competition?