Download
1 / 36
360 likes | 491 Vues
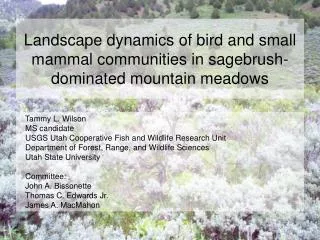
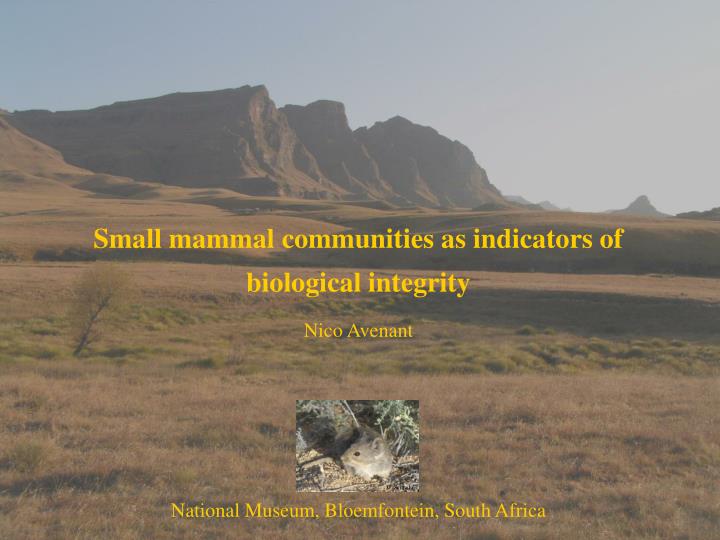
Small mammal communities as indicators of biological integrity Nico Avenant National Museum, Bloemfontein, South Africa. C. Schradin. Why small mammals?. Number of organisms: c . 66% of mammals species > 300/ha. Top predators. T.P. Jackson. Prey base. Biomass: > 10% of total

E N D
Small mammal communities as indicators of biological integrity Nico Avenant National Museum, Bloemfontein, South Africa C. Schradin
Why small mammals? Number of organisms: c. 66% of mammals species > 300/ha Top predators T.P. Jackson Prey base Biomass:> 10% of total mammalian biomass Secondary users Ecosystem engineers Prey base Primary users Seed dispersers Soil fertilisers Primary producers Growth stimulators
c. 5% spend >90% of time under ground Most small mammals “secretive” Superstitions Public poorly informed c. 3% spend >90% of time in disused termitaria c. 60% are nocturnal
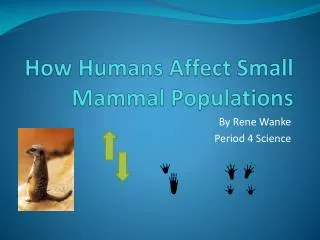
Why small mammals? * specialized and adapted for survival in “smaller” habitats(than larger mammals) – and are better indicators of ecosystem integrity on the scale that we (e.g. EIA consultants) are working on. * they are found in comparatively large numbers (a single species up to 200/ha). Rodents are, therefore, more available than larger mammals. * they are easy to handle, mark indiv’s, monitor movement, etc. * we know detailed information regarding the biology & natural histories …. * they reproduce fast (respond quickly to change) * fairly easy to ID (compared to plants, invertebrates) – teach field personnel
Indirectly literature … • changes in small mammal habitats are associated with changes in small mammal diversity • ecological disturbance of these habitats is generally associated with a decrease in small mammal species richness • a connection between the presence or absence of small mammal indicator species and disturbance in natural ecosystems a relatively quick and cheap method of indicating healthy or unhealthy ecosystem functioning?
D. MacFadyen Mice/rats, Shrews, Elephant shrews HPH Photography Shrews 7 species in Free State W. Lubbe TP Jackson
Mice 22 species in Free State 13 species in BFN-area Mice
Small mammal survey Standard method • A fixed number of traps (n = 100), are spaced 5 m apart (e.g. Ferreira & Avenant 2003) , on transects, at each site/plot • Baited with a mixture of peanut butter, rolled oats, sunflower oil and marmite • Left open for 4 consecutive nights and days • Each trap checked at dusk and dawn; rebaited when necessary Sampled by removal trapping D. MacFadyen
Beware Ecotones • Transition zones (ecological link) – area of active interaction between two or more ecosystems. • Edge effect – ecotones have different structures than neighbouring communities
Our concerns are: • how to sample and / or monitor small • mammal biodiversity, and then * to interpret this in terms of ecosystem integrity.
Mammal monitoring: - Density - Species richness - Diversity indices (e.g. Shannon, Simpson’s) - Relative abundance or evenness (e.g. Evar) - Reproductive or not - Indicator species (e.g. keystone, pioneer, generalist, specialist) - Indigenous, Endemic & Alien species- Threatened species - Protected species (e.g. CITES)
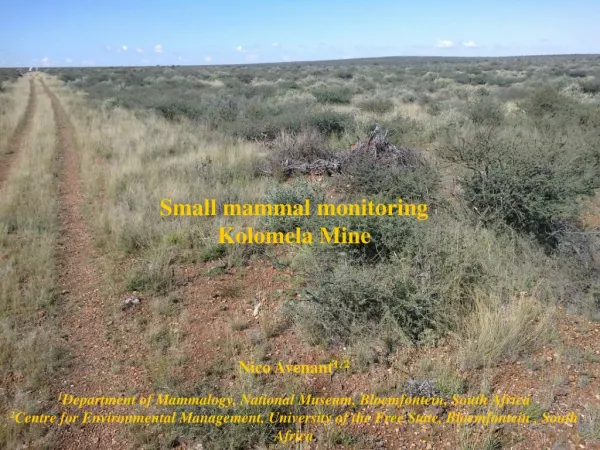
Nature reserves:Willem Pretorius NR; Sandveld NR; Caledon NRTussen-die-Riviere NR; QwaQwa NP; Erfenisdam NRConservancies:Korannaberg Farms:Game Farm, Fauresmith; Small stock farm, PhillipolisGlen Agric. Coll.SA Army training base:De Brug Environmental Impact AssessmentsMaguga Dam, Swaziland; Mohale Dam, LesothoLetsa-la-Letsie, Lesotho; CMBSLMaluti-Drakensberg Transfrontier Biodiversity ProjectOther:Ezemvelo Nature Reserve; Namibian Airports Examples
Last 12 years: 6 sites; 44 transects
Example 1 Nature reserve AVENANT, N.L. 2000. S. Afr. J. Wildl. Res.
M. minutoides Rhabdomys Aethomys E. myurus Mastomys Number of species 2 2 3 2 2 3 2 3 vs 11 / 17 5
Groups of farms on which the owners collectively practice co-operative nature conservation Ranger patrols fences, cribs & water pumps Removes snares Report mortalities & stray dogs Prevents unlawful hunting, game & cattle theft Practices proper problem-animal control measures Korannaberg Conservancy Example 2 Increase total proclaimed conservation area in the Free State Province by c. 6 times
n = 9 Why? _ vs 6
Example 3 Swaziland: Maguga Dam & Hydro-electric scheme
Table 1 The percentage frequency of grass species, number of herbs, percentage basal cover and Ecological Index value of four plots in the Caledon Nature Reserve, Free State Province, South Africa. EI, Ecological Index; -, not found. Example 4 Vegetation analysis Caledon Nature Reserve *EI, Ecological Index value * * Annual grass * Annual grass
The percentage contribution of small mammal species trapped on four transects at the Caledon Nature Reserve during four consecutive seasons in 2001/2. *Significant correlation with EI value (Pearson Product-Moment, p<0.05)
Our results Specialists Species richness Mystromys albicaudatus Diversity (evenness?) Number of species Indicator species Generalists Succession Primary productivity
some shrubs/trees; mostly perennials = climax grassveld some herbs + shrubs/ trees + more perennials Number of species Annuals + more herbs + shrubs/trees + perennials More annuals + more herbs + shrubs/trees More annuals + herbs Annuals Disturbance (Time after disturbance – Succession) Primary productivity
EIA’s Constraints: time (=money) Influence methods: - type of traps - trapping period / no. of seasons - no. of habitats Rely on Scientific studies
Rodent density in Free State grasslands c. 50% Au Au W Su Sp
Significant seasonal effect Tussen die Riviere Nature Reserve AVENANT, N.L. & CAVALLINI, P. 2007. Integrative Zoology Korannaberg Conservancy AVENANT, N.L. 2000. Navors.nas.Mus.,Bloemfontein
Seasonal effect Mean small mammal species richness and trap success on four grassland plots in the Caledon Nature Reserve, Free State Province, South Africa. Avenant, Watson & Schulze 2008. Mammalia
Duration of trapping period Korannaberg Conservancy Reached mean maximum number of species after 78 hours (3.25 days) - Avenant 2003. ACIAR Monograph Caledon Nature Reserve Avenant et al. 2008. Mammalia
Duration of trapping period Tussen die Riviere Nature Reserve AVENANT, N.L. & CAVALLINI, P. 2007. Integrative Zoology During all seasons the total number of rodent species (mean = 7 ± 0.8) were reached between 48 and 96 hours (mean = 3 ± 0.8 days), while immigration started to have a significant effect from the sixth day We standardize: 4 consecutive days and nights
Our results Specialists Species richness Mystromys albicaudatus Diversity (evenness?) Number of species Implications … Indicator species Generalists Succession Primary productivity
Thank you Acknowledgements Field assistants Jacob Senoge, Isak Sekhuni, Pieter Williamson & Jurie du Plessis Council of the National Museum, Bloemfontein National Research Foundation D. MacFadyen