Download

1 / 21
260 likes | 433 Vues
INCOME STATEMENT. LIPANA.OCAMPO.UY. Income Statement. Reports on the performance of the firm and explains some, but not all, of the changes in the assets, liabilities, and equity of the firm between two balance sheet dates REVENUE – inflows from activities or ongoing central operations

E N D
INCOME STATEMENT LIPANA.OCAMPO.UY
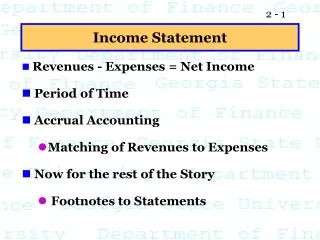
Income Statement • Reports on the performance of the firm and explains some, but not all, of the changes in the assets, liabilities, and equity of the firm between two balance sheet dates • REVENUE – inflows from activities or ongoing central operations • EXPENSES – outflows from the entity’s ongoing major or central operations • GAINS and LOSSES – increases (decreases) in equity or net assets from peripheral or incidental transactions
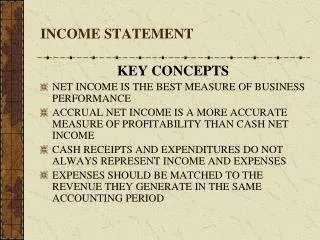
Importance of an I/S: • Shows how much a company earned or lost during the year • For purposes of analysts, investors, and potential investors • Matches the REVENUES earned from selling goods and services, or from other activities, against all COSTS AND OUTLAYS incurred in the operation of the company NET INCOME / NET LOSS
Why does it interests investors? • Shows a record of a company’s operating results for the whole year • As opposed to a B/S which is a snapshot of the company’s financial position at a specific point of time (report date) • Used to gauge a company’s potential future performance
ABC CompanyIncome Statement Excess of sales over cost of sales ~ represents the actual direct profit from sales after considering product costs = company’s health
ABC CompanyIncome Statement Gross Profit Less Expenses (from company’s day-to-day operations)
ABC CompanyIncome Statement Amount by which all revenues exceed all expenses for the year (not counting extraordinary gains or losses as defined by GAAP)
ABC CompanyIncome Statement Sum of all income and costs, including extraordinary items
Operating Margin Operating Income expressed as a percentage of sales. OI ÷ NS = OM (%) For each dollar of sales, X% remained as profit from operations OM = ? OM = 13.8% • It is a measure of the company’s profitability • It also reflect changes in volume, product line(s) or types of customers served
Operating Cost Ratio Operating Costs expressed as a percentage of sales. OC ÷ NS = OCR (%) For each dollar of sales, X% was spent for operations
Net Profit Ratio Net Income expressed as a percentage of sales. NI ÷ NS = NPR (%) For each dollar of goods sold, X% is earned in profit NPR = 6.24% NPR = ?
Other analytical metrics: • Interest Coverage • Compares a company’s long-term debt and preferred stock to its common equity (capital structure) • The lower the better • Preferred Dividend Coverage • The number of times the preferred dividend is covered (earned) by net income • Investors use ‘net profit’ as basis
Other analytical metrics: • Earnings Per Common Share (EPCS)
Other analytical metrics: • More complex earnings computations • Basic Earnings Per Common Share • Income available to common shareholders for the period, divided by the weighted-average number of common shares outstanding for the period • Diluted Earnings Per Common Share • The amount of current earnings or loss per share reflecting the maximum dilution, or negative impact, assuming the issuance of all potentially dilutive common shares
Other analytical metrics: • Price-Earnings (P/E) Ratio • Comparison of the market price of a share of stock to the earnings per share of that stock
Other analytical metrics: • Return on Total Assets • Net Income ÷ Total Assets • Return on Capital Operating Profit . (Total Assets – Current Liabilities) • Return on Investment • Net Income ÷ Total Assets
Other analytical metrics: • Gross Profit Margin • Gross Profit ÷ Net Sales • Operating Profit Margin • Operating Profit ÷ Net Sales • Net Profit Margin • Net Income ÷ Net Sales
End. Thank You!