Download
1 / 14
140 likes | 290 Vues
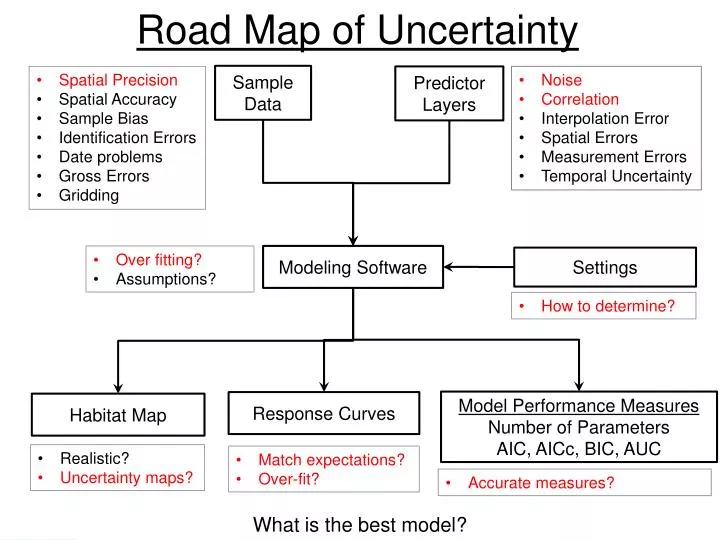
Road Map of Uncertainty. Sample Data. Spatial Precision Spatial Accuracy Sample Bias Identification Errors Date problems Gross Errors Gridding. Predictor Layers. Noise Correlation Interpolation Error Spatial Errors Measurement Errors Temporal Uncertainty. Modeling Software.

E N D
Road Map of Uncertainty Sample Data • Spatial Precision • Spatial Accuracy • Sample Bias • Identification Errors • Date problems • Gross Errors • Gridding Predictor Layers • Noise • Correlation • Interpolation Error • Spatial Errors • Measurement Errors • Temporal Uncertainty Modeling Software • Over fitting? • Assumptions? Settings • How to determine? Model Performance Measures Number of Parameters AIC, AICc, BIC, AUC Response Curves Habitat Map • Realistic? • Uncertainty maps? • Match expectations? • Over-fit? • Accurate measures? What is the best model?
Red Snapper • An important recreational and commercial species • $7 - 70 million/year www.safmc.net lickyourownbowl.wordpress.com outdooralabama.com
SEAMAP Trawls (>47,000 records) Red Snapper Occurrences (>6,000 records)
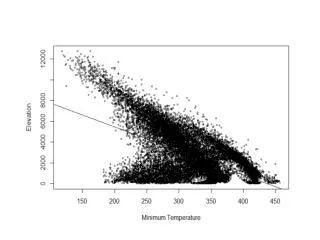
Sea Surface Temperature (SST) NOAA AVHRR Pathfinder Satellite Spatial: 9km Measured: <0.4 K Net Primary Production (NPP) Milligrams of Carbon per Meter Squared per Day OSU Ocean Productivity Uncertainty? Density of Platforms and Pipelines Created from Bureau of Ocean Energy Management (BOEM) Point Data Set Uncertainty? Bathymetry Resampled from 90m NOAA Coastal Inundation Dataset And others Uncertainty < 9km
Sample Data • Spatial Precision • Standard Deviation of about 2 km • Spatial Accuracy: • < 1km • Sampling Bias: • Some areas more heavily sampled • Identification Errors: • Unknown but red snapper are pretty easy to identify • Date problems: • Not a temporal model • Gridding: • Not at 9 kilometers
Jiggling The Samples • Randomly shifting the position of the points based on a given standard deviation based on sample uncertainty • Running the model repeatedly to see the potential effect of the uncertainty
Jiggling No Jiggling StdDev=4.4km StdDev=55km
Jiggling • Spearman’s Correlation 0 vs. 4.4km, Correlation = .997 0 vs. 55km, Correlation = .919
Uncertainty Maps • Standard Deviation of Jiggling Points by 4.4km 0.0008 0.32
References • Anderson, Model Based Inference in the Life Sciences: A Primer on Evidence • AVHRR Technical Specifications: http://data.nodc.noaa.gov/pathfinder/Version5.2/GDS_TechSpecs_v2.0.pdf • Chil’s JP, Delfiner P , Geostatistics: Modeling Spatial Uncertainty • Franklin J, Mapping Species Distributions: Spatial Inference and Prediction. Cambridge University Press, Cambridge • Hunsaker CT et. al., Spatial Uncertainty in Ecology: Implications for Remote Sensing and GIS Applications • Maxent: http://www.cs.princeton.edu/~schapire/maxent/ • Phillips SJ, Anderson RP, Schapire RE (2006) Maximum entropy modeling of species geographic distributions. Ecol Model 190 (3-4):231-259. • Warren DL, Seifert SN (2011) Ecological niche modeling in Maxent: the importance of model complexity and the performance of model selection criteria. Ecological Applications 21 (2):335-342. • Wenzhong S, Principles of Modeling Uncertainties in Spatial Data and Spatial Analyses
Other Issues… • Selecting background (absence points) • Clamping: • Prevents prediction outside the predictors used to create the model • Thresholds
Communicating Uncertainy Colleen Sullivan, 2012
Staircase of Knowledge Wisdom Judgment Understanding Comprehension Integration Knowledge Organization Interpretation Information Human value added Selection Testing Data Observation And Measurement Verification Increasing Subjectivity Environmental Monitoring and Characterization, Aritola, Pepper, and Brusseau