Download
1 / 1
10 likes | 132 Vues
Introduction. Environmental satellites are considered as useful tools for providing information on shortwave (SW) and longwave (LW) radiative fluxes at the Earth’s surface at various temporal and spatial scales.

E N D
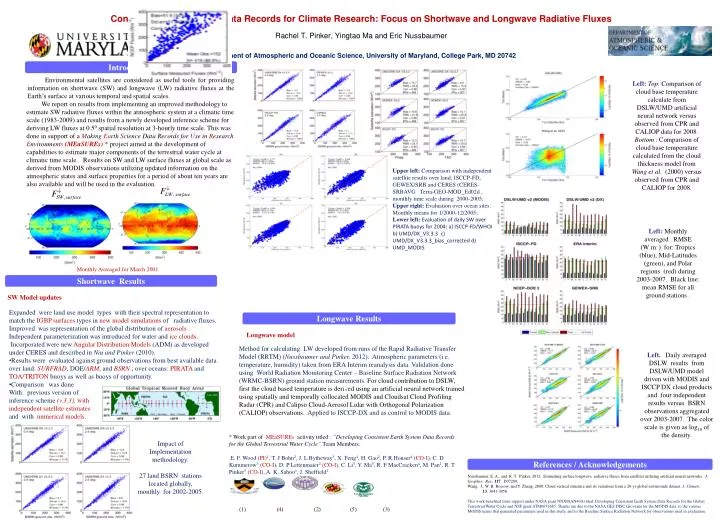
Introduction Environmental satellites are considered as useful tools for providing information on shortwave (SW) and longwave (LW) radiative fluxes at the Earth’s surface at various temporal and spatial scales. We report on results from implementing an improved methodology to estimate SW radiative fluxes within the atmospheric system at a climatic time scale (1983-2009) and results from a newly developed inference scheme for deriving LW fluxes at 0.50 spatial resolution at 3-hourly time scale. This was done in support of a Making Earth Science Data Records for Use in Research Environments(MEaSUREs) * project aimed at the development of capabilities to estimate major components of the terrestrial water cycle at climatic time scale. Results on SW and LW surface fluxes at global scale as derived from MODIS observations utilizing updated information on the atmospheric states and surface properties for a period of about ten years are also available and will be used in the evaluation. Left:Top: Comparison of cloud base temperature calculate from DSLW/UMD artificial neural network versus observed from CPR and CALIOP data for 2008. Bottom : Comparison of cloud base temperature calculated from the cloud thickness model from Wang et al. (2000) versus observed from CPR and CALIOP for 2008. Consistent Earth System Data Records forClimate Research: Focus on Shortwave and Longwave Radiative FluxesRachel T. Pinker, Yingtao Ma and Eric Nussbaumer Department of Atmospheric and Oceanic Science, University of Maryland, College Park, MD 20742 Upper left: Comparison with independent satellite results over land; ISCCP-FD, GEWEX/SRB and CERES (CERES-SRBAVG Terra-GEO-MOD_Ed02d , monthly time scale during 2000-2005; Upper right:Evaluation over ocean sites: Monthly means for 1/2000-12/2005; Lower left: Evaluation of daily SW over PIRATA buoys for 2004: a) ISCCP-FD/WHOI b) UMD/DX_V3.3.3 c) UMD/DX_V3.3.3_bias_corrected d) UMD_MODIS Left: Monthly averaged RMSE (W m- ) for: Tropics (blue), Mid-Latitudes (green), and Polar regions (red) during 2003-2007. Black line: mean RMSE for all ground stations . Monthly Averaged for March 2001 Shortwave Results SW Model updates • Expanded were land use model types with their spectral representation to match the IGBP surfaces types in new model simulations of radiative fluxes. • Improved was representation of the global distribution of aerosols . • Independent parameterization was introduced for water and ice clouds. • Incorporated were new Angular Distribution Models (ADM) as developed under CERES and described in Niu and Pinker (2010). • Results were evaluated against ground observations from best available data over land: SURFRAD, DOE/ARM, and BSRN ; over oceans: PIRATA and TOA/TRITON buoys as well as buoys of opportunity. • Comparison was done • With: previous versionof • inference scheme (v.3.3), with • independentsatellite estimates • and with numerical models. Longwave Results Longwave model Method for calculating LW developed from runs of the Rapid Radiative Transfer Model (RRTM) (Nussbaumer and Pinker, 2012). Atmospheric parameters (i.e. temperature, humidity) taken from ERA Interim reanalysis data. Validation done using World Radiation Monitoring Center – Baseline Surface Radiation Network (WRMC-BSRN) ground station measurements. For cloud contribution to DSLW, first the cloud based temperature is derived using an artificial neural network trained using spatially and temporally collocated MODIS and Cloudsat Cloud Profiling Radar (CPR) and Calipso Cloud-Aerosol Lidar with Orthogonal Polarization (CALIOP) observations. Applied to ISCCP-DX and as control to MODIS data. Left. Daily averaged DSLW results from DSLW/UMD model driven with MODIS and ISCCP DX cloud products and four independent results versus BSRN observations aggregated over 2003-2007. The color scale is given as log10 of the density. * Work part of MEaSUREs activity titled : “Developing Consistent Earth System Data Records for the Global Terrestrial Water Cycle”.Team Members: E. F. Wood (PI)1, T. J Bohn2, J. L Bytheway3, X. Feng4, H. Gao2, P. R.Houser4(CO-I), C. D Kummerow3(CO-I), D. P Lettenmaier2(CO-I), C. Li5, Y. Ma5, R. F MacCracken4, M. Pan1, R. T Pinker5(CO-I), A. K. Sahoo1, J. Sheffield1 Impact of Implementation methodology. 27 land BSRN stations located globally, monthly for 2002-2005. References / Acknowledgements Nussbaumer, E. A., and R. T. Pinker, 2012. Estimating surface longwave radiative fluxes from satellites utilizing artificial neural networks. J. Geophys. Res.,117, D07209. Wang, J., W. B. Rossow, and Y. Zhang, 2000: Cloud vertical structure and its variations from a 20-yr global rawinsonde dataset. J. Climate, 13, 3041-3056. This work benefited from support under NASA grant NNX08AN40A titled: Developing Consistent Earth System Data Records for the Global Terrestrial Water Cycle and NSF grant ATM0631685. Thanks are due to the NASA GES DISC Giovanni for the MODIS data, to the various MODIS teams that generated parameters used in this study, and to the Baseline Surface Radiation Network for observations used in evaluation. (1) (4) (2) (5) (3)