Download
1 / 32
320 likes | 467 Vues
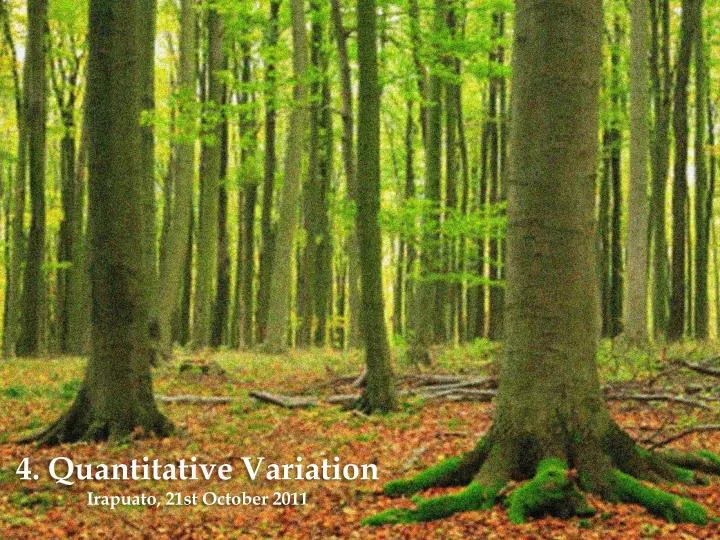
4 . Quantitative Variation Irapuato, 21st October 2011. Lecture 3: Quantitative variation. 1. Revision of basic terminology. 2. The nature of quantitative traits. 3. Introduction to QTL. 4 . Perspectives on the genotype-phenotype relationship. Ruairidh Sawers, Oct 2011.

E N D
4. Quantitative Variation Irapuato, 21st October 2011
Lecture 3: Quantitative variation 1. Revision of basic terminology 2. The nature of quantitative traits 3. Introduction to QTL 4. Perspectives on the genotype-phenotype relationship Ruairidh Sawers, Oct 2011
Revision of basic terminology 1 Qualitative: Data assigned to a classes; the classes have no numerical meaning; e.g. red, white, green Quantitative: Data can take any numerical value over a numerical range. Polygenic: A characteristic determined by the action of many genes Linkage disequilibrium: In a population, non-independence of alleles present at two sites in the genome; predominantly the result of physical linkage Quantitative trait locus (QTL): A locus contributing to a quantitative trait, typically inferred by marker-trait association Ruairidh Sawers, Oct 2011
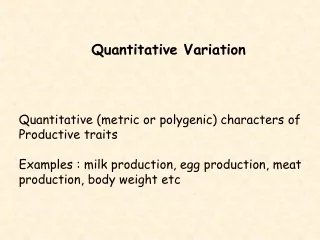
Quantitative traits “Some of the characters noted do not permit of a sharp and certain separation, since the difference is of a “more or less” nature, which is often difficult to define. Such characters could not be utilized for the separate experiments; these could only be applied to characters which stand out clearly and definitely in the plants.” Gregor Mendel, 1865 Most variation is quantitative, not qualitative – i.e. we observe a gradation of phenotype within any population While Mendel (wisely!) rejected such variation as a suitable system for experimental study, many traits of interest are quantitative Ruairidh Sawers, Oct 2011
Mendel 1st law and quantitative traits Quantitative variation is the result of the action of many Mendelian factors of small effect (QTL) Consequently, Mendelian ratios are not displayed and cannot be used to follow the action of individual genes Single progeny uninformative – the unit of study is the population Specialized mapping approaches quantify the action of QTL by linkage to markers that can be followed along standard Mendelian principles Ruairidh Sawers, Oct 2011
East and Emerson: Quantitative inheritance in maize (1911) “The outbreak of variation in the F2 generation is the result of segregation of multiple Mendelian factors that were uniformly heterozygous in the F1” Ruairidh Sawers, Oct 2011
The many significations of the phenotype Genotype 1 AAbbccddeeffgg AAbbccddeeffgg AaBbccddeeffgg aaBBccddeeffgg Genotype 2 AabbCcddeeffgg aabbCCddeeffgg Phenotype 1 AabbccDdeeffgg aabbccDDeeffgg ? AabbccddEeffgg aabbccddEEffgg Genotype Phenotype AabbccddeeFfgg aabbccddeeFFgg Genotype n AabbccddeeffGg aabbccddeeffGG Ruairidh Sawers, Oct 2011
“If certain … size factors [QTL] can be found linked with factors for qualitative [Mendelian] characters it should be possible to study independently the size … factors within each linkage group.” Karl Sax, 1923
QTL detection using markers We can detect QTL effects by linkage to markers QTL-phenotype relationship ambiguous Marker-phenotype relationship unambiguous (by definition!) Principle of QTL detection: 1) Individuals unambiguously scored for genotype at marker locus 2) Individuals scored for quantitative trait 3) Compare trait scores for marker classes 4) Infer presence of QTL linked to marker Ruairidh Sawers, Oct 2011
Single marker QTL analysis M A Marker M is linked to QTL A such that RF = c; distance = –ln(1-2c)/2 A1A2 (Lec 2) –ln(1-2c)/2 Genotypic values: Two homozygous parental lines M1A1/M1A1 and M2A2/M2A2 Genotype A1A1 A2A2 (Lec 3) Genotypic value d -a a Note: here homozygous genotypic values are –a and a (c.f. 0 and 2a), and the heterozygous value is given as d (dominance) Ruairidh Sawers, Oct 2011
Segregation of marker and QTL in the F2 Segregation in the F2 M1A1/M1A1 M2A2/M2A2 X M1A1/M2A2 Gametes: Parental Recombinant M1A1 M2A2 M1A2 M2A1 (1-c)/2 (1-c)/2 c/2 c/2 Ruairidh Sawers, Oct 2011
Expected genotypic values in the F2 Parents (P) M1A1/M1A1 x M2A2/M2A2 M1A1/M2A2 Filial 1 (F1) x (Lec 1) Ruairidh Sawers, Oct 2011
Expected phenotypes of the marker classes Therefore expected difference M2/M2 – M1/M1= 2a(1-2c) The contribution of each marker class to the phenotype mean= Sum of genotype frequency x genotypic value/class frequency Ruairidh Sawers, Oct 2011
Estimate of QTL effect using single marker is confounded by RF The expected difference M2/M2 – M1/M1= 2a(1-2c) A1A2 The true difference A2/A2 – A1/A1 = 2a Difference of QTL genotypic values is underestimated by 1/(1-2c) e.g. a marker difference of 0.2 SDs could be due to a completely linked QTL, or a QTL of effect 0.4 SDs linked with an RF of 0.25 – i.e. at a distance of 34cM Genotype A1A1 A2A2 Genotypic value d -a a Ruairidh Sawers, Oct 2011
Sax (1923) Linkage of seed size and colour in P. vulgaris Improved yellow eye 1317; Homozygous for pigment PP; Seeds 4.8g White 1228; Homozygous for no-pigment pp; Seeds 2.1g Parents differ by 4.8 – 2.1 = 2.7g Segregation in the F2 *heterozygotes distinguished by scoring F3 progeny i.e. the P allele has a positive effect on seed size Ruairidh Sawers, Oct 2011
Estimation of genotypic values in Sax (1923) Pp 2.64 2.83 3.07 = (3.07 – 2.64)/2 = 0.215g (M2/M2– M1/M1)/2= a(1-2c) The effect is almost perfectly additive; d ≈ 0 The difference PP – pp = 0.43g = 0.43/2.7 x 100 = 16% of total parental difference Genotype pp PP d -a a Seed weight Ruairidh Sawers, Oct 2011
Interpretation of Sax’s marker-trait association P QTL c = 0 c > 0 Estimates of genotypic effect are confounded with recombination between marker and QTL P P P QTL QTL QTL No measure of multiple QTLs linked to the marker; linked QTL may share effect (association) or be antagonistic (dispersion) QTL QTL Ruairidh Sawers, Oct 2011
Interval mapping M A N c1 c2 c With no interference; c = c1+ c2 In a BC Parent1 (for full derivation see Falconer and Mackay): Parental classes: M1N1/M1N1 – M1N1/M2N2 = a - d Recombinant classes: M1N1/M1N2 – M1N1/M2N1 = (a – d)(c2- c1)/c Ruairidh Sawers, Oct 2011
Recombinant inbred lines (RILs) S5? RIL lines = immortalized F2; repeatability; genotype once Ruairidh Sawers, Oct 2011
Maximum likelihood estimation of QTLs A likelihood function (L) is specified on the basis of observed data Trial values are assigned to parameters (e.g. c, means and var. QTL) Iterative methods adjust parameter fits to maximize the likelihood The test statistic is the ratio LR = L/L0 (distributed as χ2), where L0is the likelihood under the null-hypothesis of no QTL at the locus Test statistics are usually given as log10 of the LR (“LOD” or log-odds) and shown graphically with respect to chromosome position Ruairidh Sawers, Oct 2011
Biases in QTL studies • Only detect QTL at loci that are polymorphic in parents • Closely linked QTL with opposite effects tend to be missed (canceling out) • There is a lower size limit of a QTL that can be detected depending on the size of the experiment and traits • Closely linked QTL with effects in the same direction look like large effect QTL (ghost peaks) – problems with variation in recombination (genetic distance vs. physical distance) • Unless sample sizes are large, the effects of QTL are substantially overestimated Ruairidh Sawers, Nov 2011
Association analyses • Bi-parental designs only detect QTL at loci that are polymorphic in parents • Association analyses search for marker trait associations across panels of diverse lines • New populations do not need to be made • Large samples are required; both power and resolution may not equal that of QTL • Understanding of population structure required to fully interpret results Ruairidh Sawers, Oct 2011
International Maize Improvement Consortium (IMIC) Wheat Yield Consortium (WYC) Take it to the Farmers (TTF) Increased agricultural production Cultivar adoption, agronomy Breedingprograms Genetic resources Seeds of Discovery (SeeD) New genetic variation to raise future crop production
GWAS: small-effect alleles Accession 2 Accession 5,000 Accession 1 … Tester Tester Tester Ultrahigh-density genome profiles Field trials across Mexico Mine genebanks Genome-wide prediction models Favorable haplotypes
A “toy” example: Petal pigments in foxglove (Digitalis) M Precursors Anthocyanin Throat spots W Rest of petal D Suppose we want to breed for dark red petals What if all the lines in our breeding pool are D;W or dw? What if D and W are linked, and in our collection are always found in coupling phase? + Ruairidh Sawers, Oct 2011
Example: Genetics and genomics resources in maize • Large collections of natural diversity; classical genetic resources; reverse genetics systems • B73 reference genome and a number of whole genome sequence data sets (including Palomero Toluqueño) • Structured mapping populations, including “classical” RILs, NILs, and the NAM • High-throughput genotyping platforms including 55k SNP chip and GBS Ruairidh Sawers, Oct 2011
Phenotyping tools Patrice Dubois High-throughput phenotyping in a maize field using a bar-code reader, and a custom tools Patrice Dubois Ruairidh Sawers, Oct 2011
“Phenomics” Scott Chapman, CSIRO Plant Industry Imaging: Colour, Near IR, Far IR, Chlorophyll fluorescence, Hyperspectra Quantification: Plant area, volume, mass, structure, senescence, chlorophyll content, pathogenic lesions, yield ,water content, temperature, salt tolerance, carbohydrates, pigments, protein, etc, etc Ruairidh Sawers, Oct 2011
Revision of basic terminology 1 Qualitative: Data assigned to a classes; the classes have no numerical meaning; e.g. red, white, green Quantitative: Data can take any numerical value over a numerical range. Polygenic: A characteristic determined by the action of many genes Linkage disequilibrium: In a population, non-independence of alleles present at two sites in the genome; predominantly the result of physical linkage Quantitative trait locus (QTL): A locus contributing to a quantitative trait, typically inferred by marker-trait association Ruairidh Sawers, Oct 2011
Quantitative variation • QTL can be detected and their effects estimated on the basis of linkage to marker loci • By using diverse material, association analyses can give a fuller picture of genetic architecture and detect novel QTL • Advances in genotyping and phenotyping are revolutionizing understanding of the genotype – phenotype relationship rsawers@langebio.cinvestav.mx Laboratory of Maize Genetics and Genomics, Lab 9, LANGEBIO Ruairidh Sawers, Oct 2011