Download
1 / 28
350 likes | 1.25k Vues
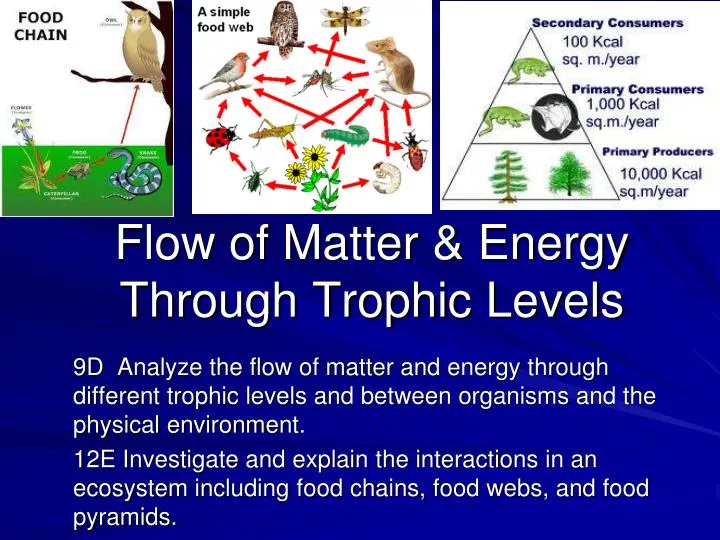
Flow of Matter & Energy Through Trophic Levels. 9D Analyze the flow of matter and energy through different trophic levels and between organisms and the physical environment. 12E Investigate and explain the interactions in an ecosystem including food chains, food webs, and food pyramids.

E N D
Flow of Matter & Energy Through Trophic Levels 9D Analyze the flow of matter and energy through different trophic levels and between organisms and the physical environment. 12E Investigate and explain the interactions in an ecosystem including food chains, food webs, and food pyramids.
Transfer of Materials and Energy in an Ecosystem • Energy moves through an ecosystem in only onedirection and then is lost. • Materials are recycled_through the ecosystem. (oxygen, carbon, nitrogen, water, and etc.) • Food chain – shows _one_possible pathway for energy and materials through an ecosystem.
Transfer of Materials and Energy in an Ecosystem • Food web – shows _many_ pathways for energy and materials through an ecosystem.
Energy Pyramid • Trophic level – is represented by each organism in a food chain. • 10% rule – only 10%_ of the available energy in one trophic level is transferred to the next trophic level. The rest of the energy is lost as heat or used by each organism to carry on life processes.
VOCABULARY • Producer – Makes its own food. (plants) • Consumer – Must get its food from another organisms_.(humans) • Autotroph – _Producers____ • Heterotroph – Consumers__
VOCABULARY • Biotic – Is or was _alive____. • Abiotic – was never alive. (rocks, dirt, air) • Herbivores – Eats _plants_______ • Carnivores – Eats __meat______ • Omnivore – Eats _plants and _meat__ • Decomposers – bacteria and fungi that break down _dead__ plants and animals
Carrying Capacity • Carrying capacity is the _size__ of the population that can be maintained over a long period of time in an ecosystem. • Carrying capacity is limited by _resources_ such as food and water.
1. The diagram represents different levels of a marine food pyramid. Between which two levels is the greatest amount of energy transferred? • R and Q • S and R • T and S • U and T
1. The diagram represents different levels of a marine food pyramid. Between which two levels is the greatest amount of energy transferred? • R and Q • S and R • T and S • U and T
2. The diagram above is intended to show relationships in an ecosystem. What do the arrows represent? • The direction of population migration • Differences in dietary habits • Progressively smaller organisms • The direction of energy flow
2. The diagram above is intended to show relationships in an ecosystem. What do the arrows represent? • The direction of population migration • Differences in dietary habits • Progressively smaller organisms • The direction of energy flow
3. Energy used by producers in a grassland food web is provided by — • Sunlight • Photosynthesis • Oxygen • Carbon dioxide
3. Energy used by producers in a grassland food web is provided by — • Sunlight • Photosynthesis • Oxygen • Carbon dioxide
4. In this food web, the bacteria probably function as — • Producers • Herbivores • Decomposers • Carnivores
4. In this food web, the bacteria probably function as — • Producers • Herbivores • Decomposers • Carnivores
5. A food pyramid represents the relative amount of energy in trophic levels. Which of the following correctly shows a food pyramid?
5. A food pyramid represents the relative amount of energy in trophic levels. Which of the following correctly shows a food pyramid? C
6. The diagram shows several phases of the nitrogen cycle. Which of the following describes the most likely effect of removing some plants from the area by using chemical herbicides? • The rate of erosion of rocks on the ground would be slowed. • The flow of necessary nutrients would be disrupted. • The ability of plants to complete photosynthesis would be increased. • The infiltration of water into the ground would be halted.
6. The diagram shows several phases of the nitrogen cycle. Which of the following describes the most likely effect of removing some plants from the area by using chemical herbicides? • The rate of erosion of rocks on the ground would be slowed. • The flow of necessary nutrients would be disrupted. • The ability of plants to complete photosynthesis would be increased. • The infiltration of water into the ground would be halted.
7. About 10% of the energy at one trophic level is passed to the next level. What usually happens to the energy that is not passed to the next trophic level or used to carry out life processes? • It is given off as heat. • It is stored as vitamins. • It is used in reproduction. • It is used in protein synthesis.
7. About 10% of the energy at one trophic level is passed to the next level. What usually happens to the energy that is not passed to the next trophic level or used to carry out life processes? • It is given off as heat. • It is stored as vitamins. • It is used in reproduction. • It is used in protein synthesis.
8. Which diagram best shows how the amount of stored energy changes going up a food chain?
8. Which diagram best shows how the amount of stored energy changes going up a food chain? A
9. The diagram shows a standard pyramid of numbers that indicates the number of individual organisms in a community. Which of the following situations would form a pyramid showing more consumers than producers? • A small plot with 500 corn plants and 100 grasshoppers • One pond with 300 producers and one snake • An 11,000 m 3 lake with 75 fish and one alligator • One giant oak tree with 10,000 insects and 10 lizards
9. The diagram shows a standard pyramid of numbers that indicates the number of individual organisms in a community. Which of the following situations would form a pyramid showing more consumers than producers? • A small plot with 500 corn plants and 100 grasshoppers • One pond with 300 producers and one snake • An 11,000 m 3 lake with 75 fish and one alligator • One giant oak tree with 10,000 insects and 10 lizards
10. White-tailed deer meet their energy needs through which of these activities? • Drinking water • Absorbing sunlight • Eating plants • Exhaling carbon dioxide
10. White-tailed deer meet their energy needs through which of these activities? • Drinking water • Absorbing sunlight • Eating plants • Exhaling carbon dioxide