Download
1 / 56
560 likes | 711 Vues
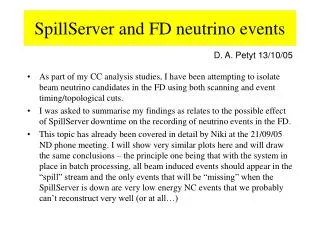
FD events and fit considerations. D. A. Petyt – CC summary talk 15/10/05. I intend to cover two topics in this talk: FD beam events Selecting events, signal and backgrounds, event characteristics… Event selection by topological cuts, data/MC comparison (Niki)

E N D
FD events and fit considerations D. A. Petyt – CC summary talk 15/10/05 • I intend to cover two topics in this talk: • FD beam events • Selecting events, signal and backgrounds, event characteristics… • Event selection by topological cuts, data/MC comparison (Niki) • Event scan, selection by topology/timing, data/MC comparison (David) • Optimisation of fiducial volume for CC analysis, data and cosmic background rates (Andy C.) • Beam energy decision & oscillation fit at 1e20 p.o.t • General considerations • Reminder of 1e20 sensitivity & break-point between LE/ME sensitivity • Fit procedure • my thoughts on data/mc match-up in ND • ND/FD extrapolation – various approaches: “Know nothing” extrapolation (Trish/Jenny) Flux extraction from fit to ND data (Masaki)
FD event studies - goals • Look at FD “spill” events (with blinding scheme imposed) to determine • Whether we observe neutrino interactions at roughly the expected rate (i.e constant number of nu/pot) • Whether the events look “OK” – both in terms of general appearance and reconstructed quantites • What backgrounds exist and how to remove them
Analysis #1 – FD event selection using topological cuts - Niki This sample uses the “cosmic” reconstruction config – the cosmics in this sample won’t properly represent those in the “spill” sample, but can be used as a check • Event sample used – “Open” dataset from Jun 1- Aug 31, corresponding to 4.07e19 p.o.t. This sample uses the same “beam” reconstruction config. as the neutrino events
True neutrinos should be located in a 10us time window • Selected events were scanned and classified as signal or background
These are typical “junk” events – radioactive noise in the spill trigger window forming a single low energy shower
Analysis #2 – FD scan/selection cuts for events with tracks - David • Scanned reconstructed FD “spill” files (with blinding applied) from Jun 1 – 19 Sept (LE-10 running, 5.1e19 p.o.t). • 1348 events scanned and classified into the following categories: • Comments on the scan: • Beam neutrino events are in general very distinctive and it is very easy to distinguish them from background • The large number of “junk” events is dominated by radioactive noise in the spill trigger window. These are also pretty distinctive although it may be difficult to separate these from the very lowest energy NC events • There are a few LI events in the “spill” files, most (if not all) are accompanied by trigger PMT hits (a cut on this removes 15 or the 17 LI events). In any case, they are rather distinctive and do not look at all like neutrino interactions • The “problem” events are typically small events that occur close to the edge of the detector • Small showers that could be NC events or incoming junk • Short tracks where the directionality is not clear.
Cut #2: timing wrt FD spill prediction: –20us<t<30us Junk event
Cut #3: event must contain a reconstructed track Vast majority of “junk” is 0 track + 1 shower…
Cut #5: track vertex r2<14 m2 Cosmics pile up around detector edge – expect uniform distribution for neutrinos
Result of cut sequence • On the assumption that all 139 candidates are real neutrinos, the efficiency of the selection cuts is 88/139=63.3%.
Effect of cuts on MC events • Efficiency of cuts on MC: 81797/128631=63.6%, which agrees well with data (assuming scan efficiency is high of course…)
Neutrinos vs time • Ratio of neutrinos/pot seems pretty constant.
FidVol optimisation – Andy C. • Want to optimise the current analysis cuts (PID and FidVol) and see if there are any differences between optimal cuts for best resolutions in sin22q and Dm2. • Proposed new FidVol cuts for CC: • 20cm distance to edge cut & 40cm inner radial cut • 3 plane cut at front of SM1&2 and back of SM1 • 13 plane cut at the back of SM2 • If all optimal cuts are used improvement in resolution of 14.8% in sin22q and 10.2% in Dm2.
Parameter measurement errors vs fiducial cut Radial cut End of SM 2 cut • Increase in statistics over-compensates loss in resolution for radial cut – implication is to push this as far as you can before running into problems with background contamination • Optimum z vtx cut –13 planes. There is a minimum here – as you go further downstream in z, the events become poorly measured and identified and the increase in statistics in offset by worse energy resolution
Potential Energy Bias Event passing existing cuts : New events added by relaxing cuts • There is some loss in shw energy for these new events, but the difference is only in the order of 3-4%, so as long as simulation of shw size is reasonable, should not be an issue. • Can assume trk energy reconstruction will suffer no bias due to the use of the TrackFitter.
Effect on cosmic MC • ~50,000 Full spectrum Cosmics (processed with SR beam config) corresponds to ~36hrs of exposure. • Detector is ‘open’ to Cosmics for only 100ms every spill, approx every 2.5s, so a total exposure time of 5.2s in 36hrs, so this sample corresponds to ~100 yrs spill data. • Application of a cut on trk direction relative to beam and track dt/ds removes most of cosmic background with little impact on beam events • Background with relaxed cuts =0.68 cosmic/yr in spill window • Loss of beam MC acceptance ~4% All cosmic Old fidvol cuts Relaxed fidvol cuts
FD Beam data • Looked at July, August and half of September R1_18 blinded spill data. • Applied sensible Beam info cuts: • PoT > 1.5E11 • -2mm < hpos < 0mm • 0mm < vpos < 2mm • -5000V < Magnet Voltage < -4500V • -179.5 kA < Horn Current < -178.5 kA • Target Position > 0 • Also require reconstructed track, PID>-0.4 and LI_time < 0 • With existing Fidvol conditions: • - 34 events • - 32 Beam • - 1 Cosmic • With relaxed Fidvol conditions: • - 45 events • - 43 Beam (34% increase) • - 1 Cosmic (0% increase) • From MC we expect increases of 27% and 349% in Beam and Cosmics • - Due to Beam cuts this represents ~1.5 months data taking, so would expect to see 0.3 cosmics for existing fidvol and 1.4 for relaxed fidvol.
Problems #1: events occurring before FD spill time • Niki found 6 of 106 neutrino events that occur (just) outside the 0-10 us spill timing window • A visual scan shows that the events look OK • The time distribution of the strips in the event relative to the trigger time (bottom plot) also looks reasonable • The earliest strip in these events occurs >200ns before the spillserver prediction. Is there an understood mechanism for this? • GPS “error” quoted as 200 ns…
Problems #2 – Events with “late” digits • Niki also noticed that the time width of events (time of latest strip – time of earliest strip) was of the order of 10-50 us for almost ½ of the neutrino candidates, as opposed to the expected ~100ns time width • This is caused by the reconstruction code picking up random noise hits in the spill trigger window and adding them to the event • Given the short time window, this should not significantly affect reconstructed quantities • These hits can (and should) be removed by applying some loose timing criteria in the event formation
Problems #3 – Displaced event vertices Track vertex Shower vertex • Andy observed that the event vertex for cosmic events tends to be displaced whenever there is a reconstructed shower (brem, delta ray...) on the track • We think the vertex finder in the beam config assumes the primary track and shower should originate at the same point, and computes an “average” vertex position if they do not • The net result of this is that the event vertex of cosmic events can be within the fiducial volume, even though the primary track vertex is not • Should therefore use track vertex for fiducial cuts if it is available • Josh is aware of this and improvements will be made to the next software release shower
Event characteristics and data/MC comparisons • The next several slides show comparisons between basic distributions for selected data and MC events (with the same cuts applied) • Because of blinding/oscillations, we don’t expect all distributions to agree • Physics distributions will be distorted, but we should at least be able to check if there are any glaring pathologies (i.e. unphysical “spikes”) • Lower level quantities (such as pulse height/plane) should be unaffected • I have indicated the distributions that will be significantly affected by blinding/oscillations with the label “B” • All plots are normalised to the same area. • I will show plots separately for Niki’s events (events with 0 and 1+ tracks) and my events (events with 1+ tracks only)
Track vertex x-y projection • LHS plot should be uniform in x-y • RHS plot should be focussed towards origin for numu events and defocussed for numu_bar events
Track Vertices #2 Background could appear in these areas Background could appear in these areas
Track fit parameters • Track fitting performance seems very similar between data and MC. • Similar rate of failures <5% (slightly lower in data than MC) • Track q/p distribution distorted by blinding/oscillations… B
Track variables B • Track length is (should be!) distorted. • Track ph/plane variables should be largely invariant • Slight excess of high ph/plane events in data? • Track digits/plane slightly lower in data • Could be caused by lower per plane tracking efficiency in the data
Event length and ph variables B • Reasonable match-up given the statistics – track ph/plane looks a bit higher in data… Event length (planes) Pulse height per plane B Shower pulse height Track pulse height per plane
Shower reconstruction • Data showers tend to reconstruct more clusters with higher average energy • Could be an artifact of blinding • However shower pulse height per digit is also somewhat higher – this should be largely invariant to blinding/osc. B
“Physics” quantities B • Most of these will be distorted by blinding and oscillations • However, the general shape of the distributions seems reasonable – there are no glaring “pathologies”… B B
B B
Per-strip quantities • Track and shower ph/strip seem slightly (~5%) lower in data than MC.
B B Slight excess of NC/deficit of CC – blinding and/or oscillations!
Likelihood-based PDF B • Optimal cut to separate CC and NC (for R1.18) is PID>-0.2 • Higher fraction of NC-like events in the data, which is largely due to the shorter event length distribution. This could be due to oscillations and/or blinding…
FD event selection conclusions • Beam neutrino events are very distinctive and it is quite easy to isolate them with either timing and/or topology cuts • The backgrounds appear to be small and can probably be reduced further. This may allow us to use a larger fiducial region for the analysis • So far, the best selection efficiency we have achieved is 87% • Short events at the edge of the detector tend to be the most problematic • The rate of neutrino events observed follows the beam intensity well • So far, the match-up of data and MC shows no large discrepancies: • At least as far as we can tell with these statistics and with blinding/oscillations • There are some small differences in “invariant” quantities, which should be investigated further, but no pathological effects have been observed • There are some minor timing/reco issues to be looked at further or fixed (offset in true-predicted time, event vertex shift etc.)
Some thoughts on 1e20 p.o.t analysis and opening the box… • Our plan is to open the box once we have accumulated ~1e20 p.o.t. and make our first determination of the value of Dm2 • This should provide a check as to whether we are running at the right beam energy • Older calculations show the the cross-over between LE and ME sensitivity is Dm2~0.005 eV2. Should be re-done for newer beam/reco, but I doubt that the cross-over value will change much • Given the difference between the signals at Dm2 = 0.002 and 0.005, it’s clear that we should be able to tell them apart unless we have very major differences between data and MC
Comments on ND data/MC match-up • In order to write a paper on the 1e20 data, we will need to be able to demonstrate that we understand our near detector data at a level sufficient to predict the FD spectrum without significant bias in the oscillation measurement. • At the moment, despite significant study, there are still fairly large data/MC differences • These could be detector/reco effects, physics (beam/x-sec) or both… • How do we do the extrapolation in this case? • Ideally, we want to factorise detector-specific differences (which can be modelled or fixed) and the remaining differences (which can be attributed to physics) should be within the systematic error envolope from beam/x-sec uncertainties • However, there may be residual differences that won’t be understood on this timescale
Alternate approach to ND/FD fits – Trish/Jenny • Take what we measure in the ND, use the Far/Near ratio and selection efficiencies from the MC to predict what the FD spectrum should look like in the case of no oscillations and oscillations with given values of (delta m^2, sin^2(2theta)). Use Minuit to fit for sin^2(2theta) and delta m^2. • Approach different from David's method—provides an independent check • Doesn't assume differences between data and MC in the ND spectrum are parameterizable • Uses bin by bin differences between data and MC in the ND as basis for errors on the FD spectrum • Minimization technique using Minuit is fast • Doesn't need multiple loops over nuisance parameters • Allows for 1000's of pseudo-experiments
Calculating errors on the FD spectrum prediction • Find the relative difference between Data/MC in ND for each bin of reco energy. • Determine the error in bins of true energy by histogramming the true energy for each bin of reco energy, weighted by 1+/- the relative error from step 1, then add up these histograms. • Determine relative error for each bin of true neutrino energy. • Relative errors on the true energy applied to the true energy in the FD. • Add Beam syst. errors from F/N ratio (linearly) • Histogram reco energy in FD for each bin of true energy, weighted by 1+/- the relative error of step 4. Sum histograms. Half the spread between the 1+error and 1-error histograms is taken as the error in each bin of reconstructed energy in the FD.
Computing the FD error envelope Far/near Error bars on FD prediction are +/- 1 sigma systematic
Example results Systematics dominated here – doesn’t scale as sqrt(N)
Potential Pitfalls at 1e20 0.0022eV2 0.005eV2 Fits are more stable at high dmsq…