Download
1 / 29
290 likes | 523 Vues
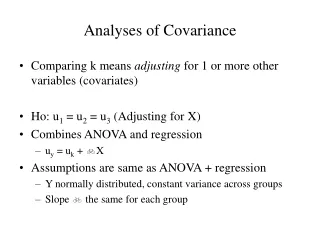
Analysis of Covariance. Goals:. Reduce error variance. Remove sources of bias from experiment. Obtain adjusted estimates of population means. Analysis of Covariance. Y. Y. X .1. X . X .2. X. X .1. X. X .2. X . Random assignment conditional distribution is less variable.

E N D
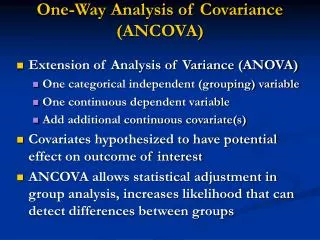
Analysis of Covariance Goals: • Reduce error variance. • Remove sources of bias from experiment. • Obtain adjusted estimates of population means.
Analysis of Covariance Y Y X.1 X.. X.2 X X.1 X X.2 X.. Random assignment conditional distribution is less variable Not randomly assigned Need to block
Analysis of Covariance Selection of covariates: • Experiment contains one or more nuisance, uncontrollable, variables that we know. • Control of these variables is either not possible or not feasible. • It is possible to obtain a measure of the nuisance variable that doesn’t include effects attributable to the factors: a) the covariate is obtained prior to presentation of factor levels, b) the covariates are obtained after the levels are set but before they affect, c) it can be assumed that they are not affected by the factor levels. (These are not always necessary).
Analysis of Covariance Model:
Analysis of Covariance Some more assumptions for the above model: • The slope b does not equal zero. • The relationship between Yij and Xij is linear. • The regression coefficients for each factor level are equal. • The covariate variable Xij is not affected by the levels of the factor.
Analysis of Covariance Hypotheses:
Analysis of Covariance Back to 401 • Simplest, most reduced model: The fitted model:
Analysis of Covariance • Simplest, most reduced model (Cont.): Residual: and Difference from Grand Mean. Total error we still need to explain. Degrees of Freedom for this error:
Analysis of Covariance How to perform the analysis of covariance: • Wanted to explain more, added the factor. The linear model became: The fitted model:
Analysis of Covariance • Cont. Residual: How much did we explain from the original total residual? Original total residual. Part of residual explained by Factor A. Part of residual still not accounted for. = Syy - Eyy Tyy
Analysis of Covariance • Cont. Rearrange: Total original Residual Part of residual explained by Factor A. Part of residual still not accounted for Syy Tyy Eyy New: ANCOVA Old: ANOVA SST SSA SSE df
Analysis of Covariance • Adding the covariate: The fitted model:
Analysis of Covariance • Cont. Can show that:
Analysis of Covariance • Cont. And so:
Analysis of Covariance • Cont. Residual:
Analysis of Covariance • Cont. Residual: How much did we explain from the original total residual? Part of residual explained by covariate Part of residual explained by factor A Part of residual not accounted for after adjusting using the covariate and the factor Total original Residual
Analysis of Covariance • Cont. Rearrange: explained by covariate explained by factor not accounted for by full model Total original Residual df
Analysis of Covariance Lets go the other route: • Simplest, most reduced model: The fitted model:
Analysis of Covariance • Simplest, most reduced model (Cont.): Residual: and Difference from Grand Mean. Total error we still need to explain. Degrees of Freedom for this error:
Analysis of Covariance • Want to explain more, add covariate. The linear model became: The fitted model:
Analysis of Covariance • Cont. Can show that:
Analysis of Covariance • Cont. Residual:
Analysis of Covariance • Cont. Residual: How much did we explain from the original total residual? Original total residual. Part of residual still not accounted for. Part of residual explained by covariate.
Analysis of Covariance • Cont. Rearrange: Total original Residual Explained by covariate. not accounted for by regression df
Analysis of Covariance • Compare the errors: Part of residual not accounted for after adjusting using the covariate and the factor Along with its df. Part of residual not accounted for after regression along with its df.
Analysis of Covariance • Compare the errors (Cont.): The difference is what the factor accounts for.
Analysis of Covariance A study to compare the strength of monofilament fiber produced by three different machines: Three factors: Machine 1 (m1), Machine 2 (m2), and Machine 3 (m3). Covariate: is the thickness of the fiber.
Analysis of Covariance Hypotheses: