Download
1 / 58
600 likes | 796 Vues
Data Warehousing and OLAP. Warehousing. Growing industry: $8 billion in 1998 Range from desktop to huge: Walmart: 900-CPU, 2,700 disk, 23TB Teradata system Lots of buzzwords, hype slice & dice, rollup, MOLAP, pivot,. Outline. What is a data warehouse? Why a warehouse? Models & operations

E N D
Warehousing • Growing industry: $8 billion in 1998 • Range from desktop to huge: • Walmart: 900-CPU, 2,700 disk, 23TBTeradata system • Lots of buzzwords, hype • slice & dice, rollup, MOLAP, pivot, ...
Outline • What is a data warehouse? • Why a warehouse? • Models & operations • Implementing a warehouse • Future directions
more What is a Warehouse? • Collection of diverse data • subject oriented • aimed at executive, decision maker • often a copy of operational data • with value-added data (e.g., summaries, history) • integrated • time-varying • non-volatile
What is a Warehouse? • Collection of tools • gathering data • cleansing, integrating, ... • querying, reporting, analysis • data mining • monitoring, administering warehouse
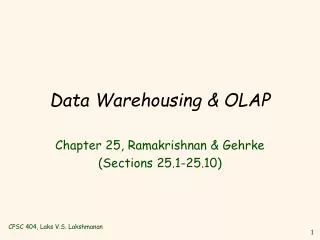
Client Client Query & Analysis Warehouse Integration Source Source Source Warehouse Architecture Metadata
? Source Source Why a Warehouse? • Two Approaches: • Query-Driven (Lazy) • Warehouse (Eager)
Client Client Mediator Wrapper Wrapper Wrapper Source Source Source Query-Driven Approach
Advantages of Warehousing • High query performance • Queries not visible outside warehouse • Local processing at sources unaffected • Can operate when sources unavailable • Can query data not stored in a DBMS • Extra information at warehouse • Modify, summarize (store aggregates) • Add historical information
Advantages of Query-Driven • No need to copy data • less storage • no need to purchase data • More up-to-date data • Query needs can be unknown • Only query interface needed at sources • May be less draining on sources
OLTP: On Line Transaction Processing Describes processing at operational sites OLAP: On Line Analytical Processing Describes processing at warehouse OLTP vs. OLAP
Mostly updates Many small transactions Mb-Tb of data Raw data Clerical users Up-to-date data Consistency, recoverability critical Mostly reads Queries long, complex Gb-Tb of data Summarized, consolidated data Decision-makers, analysts as users OLTP vs. OLAP OLTP OLAP
Data Marts • Smaller warehouses • Spans part of organization • e.g., marketing (customers, products, sales) • Do not require enterprise-wide consensus • but long term integration problems?
Warehouse Models & Operators • Data Models • relations • stars & snowflakes • cubes • Operators • slice & dice • roll-up, drill down • pivoting • other
Terms • Fact table • Dimension tables • Measures
Dimension Hierarchies sType store city region è snowflake schema è constellations
Cube Fact table view: Multi-dimensional cube: dimensions = 2
day 2 day 1 3-D Cube Fact table view: Multi-dimensional cube: dimensions = 3
ROLAP vs. MOLAP • ROLAP:Relational On-Line Analytical Processing • MOLAP:Multi-Dimensional On-Line Analytical Processing
Aggregates • Add up amounts for day 1 • In SQL: SELECT sum(amt) FROM SALE • WHERE date = 1 81
Aggregates • Add up amounts by day • In SQL: SELECT date, sum(amt) FROM SALE • GROUP BY date
Another Example • Add up amounts by day, product • In SQL: SELECT date, sum(amt) FROM SALE • GROUP BY date, prodId rollup drill-down
Aggregates • Operators: sum, count, max, min, median, ave • “Having” clause • Using dimension hierarchy • average by region (within store) • maximum by month (within date)
rollup drill-down Cube Aggregation Example: computing sums day 2 . . . day 1 129
Cube Operators day 2 . . . day 1 sale(c1,*,*) 129 sale(c2,p2,*) sale(*,*,*)
Extended Cube * day 2 sale(*,p2,*) day 1
day 2 day 1 Aggregation Using Hierarchies customer region country (customer c1 in Region A; customers c2, c3 in Region B)
day 2 day 1 Pivoting Fact table view: Multi-dimensional cube:
Implementing a Warehouse • Monitoring: Sending data from sources • Integrating: Loading, cleansing,... • Processing: Query processing, indexing, ... • Managing: Metadata, Design, ...
new Monitoring • Source Types: relational, flat file, IMS, VSAM, IDMS, WWW, news-wire, … • Incremental vs. Refresh
Monitoring Techniques • Periodic snapshots • Database triggers • Log shipping • Data shipping (replication service) • Transaction shipping • Polling (queries to source) • Screen scraping • Application level monitoring è Advantages & Disadvantages!!
Monitoring Issues • Frequency • periodic: daily, weekly, … • triggered: on “big” change, lots of changes, ... • Data transformation • convert data to uniform format • remove & add fields (e.g., add date to get history) • Standards (e.g., ODBC) • Gateways
Client Client Query & Analysis Metadata Warehouse Integration Source Source Source Integration • Data Cleaning • Data Loading • Derived Data
billing DB customer1(Joe) merged_customer(Joe) service DB customer2(Joe) Data Cleaning • Migration (e.g., yen ð dollars) • Scrubbing: use domain-specific knowledge (e.g., social security numbers) • Fusion (e.g., mail list, customer merging) • Auditing: discover rules & relationships(like data mining)
Loading Data • Incremental vs. refresh • Off-line vs. on-line • Frequency of loading • At night, 1x a week/month, continuously • Parallel/Partitioned load
Derived Data • Derived Warehouse Data • indexes • aggregates • materialized views (next slide) • When to update derived data? • Incremental vs. refresh
does not exist at any source Materialized Views • Define new warehouse relations using SQL expressions
Client Client Query & Analysis Metadata Warehouse Integration Source Source Source Processing • ROLAP servers vs. MOLAP servers • Index Structures • What to Materialize? • Algorithms
ROLAP server utilities relational DBMS ROLAP Server • Relational OLAP Server tools Special indices, tuning; Schema is “denormalized”
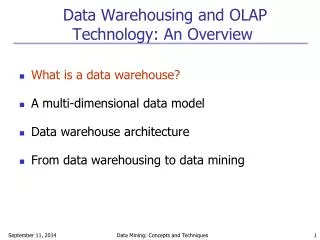
Sales City B A milk soda eggs soap Product 1 2 3 4 Date utilities MOLAP Server • Multi-Dimensional OLAP Server M.D. tools multi-dimensional server could also sit on relational DBMS
Index Structures • Traditional Access Methods • B-trees, hash tables, R-trees, grids, … • Popular in Warehouses • inverted lists • bit map indexes • join indexes • text indexes
Inverted Lists . . . data records inverted lists age index
Using Inverted Lists • Query: • Get people with age = 20 and name = “fred” • List for age = 20: r4, r18, r34, r35 • List for name = “fred”: r18, r52 • Answer is intersection: r18
Bit Maps . . . age index data records bit maps
Using Bit Maps • Query: • Get people with age = 20 and name = “fred” • List for age = 20: 1101100000 • List for name = “fred”: 0100000001 • Answer is intersection: 010000000000 • Good if domain cardinality small • Bit vectors can be compressed
Join • “Combine” SALE, PRODUCT relations • In SQL: SELECT * FROM SALE, PRODUCT
Join Indexes join index
What to Materialize? • Store in warehouse results useful for common queries • Example: total sales day 2 . . . day 1 129 materialize