Download
1 / 37
381 likes | 698 Vues
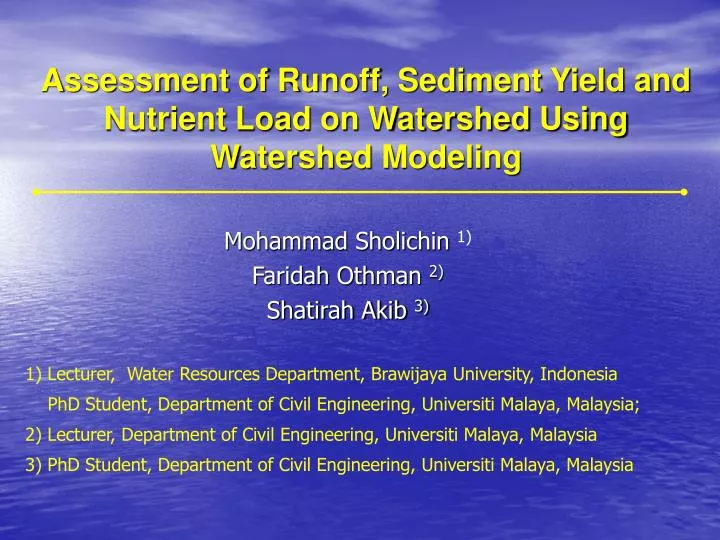
Assessment of Runoff, Sediment Yield and Nutrient Load on Watershed Using Watershed Modeling. Mohammad Sholichin 1) Faridah Othman 2) Shatirah Akib 3). 1) Lecturer, Water Resources Department, Brawijaya University, Indonesia

E N D
Assessment of Runoff, Sediment Yield and Nutrient Load on Watershed Using Watershed Modeling Mohammad Sholichin 1) Faridah Othman 2) Shatirah Akib 3) 1) Lecturer, Water Resources Department, Brawijaya University, Indonesia PhD Student, Department of Civil Engineering, Universiti Malaya, Malaysia; 2) Lecturer, Department of Civil Engineering, Universiti Malaya, Malaysia 3) PhD Student, Department of Civil Engineering, Universiti Malaya, Malaysia
Background • Increasing population people, wastewater from industry and fertilizer use for farmer become water quality problem in stream. • Main problem in Upstream Brantas River Basin are land erosion, sedimentation and pollutant load from both agricultural area and residential • Propose of watershed modeling (AVSWAT) to predict water quality by difference management practice
The main objective of this research are : • to assessment of runoff, sediment yield and nutrient load at Watershed • To identification of potentially source of sediment and nutrient load on watershed • to propose the relationship relating sediment and nutrient loads to physiographic and hydrologic properties of the each sub watershed
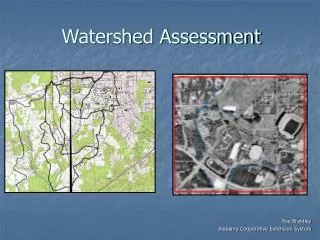
Upstream Brantas River Banggo River Basin Upstream Brantas Amprong River Basin Metro River Basin Manten River Basin Upper Lesti River Basin Lower Lesti River Basin Kedung Banteng River Basin Genteng River Basin
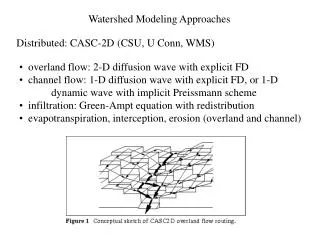
Soil Water Assessment Tool (SWAT) • Uses physically-based input such as soil, weather, land use, and topographic data to predict the impact of land management practice on water, sediment, and agricultural chemical yields • Continuous Long-term Simulation on daily step • Assesses impacts of climate and management on yields of water, sediment, and agricultural chemicals
AVSWAT Routing Phase • Flow routing - Inputs (runoff, rain, point-source discharge) - Outputs (evaporation, transmission, extraction for human use) • Sediment routing: deposition, resuspension, erosion • Nutrient Routing - Model dissolved and adsorbed nutrients. - In stream kinetics adapted from QUAL2E
SWAT Setup Preparation • Period of Calibration: January 1, 1992 – Dec 2002 • Period of Validation : Jan 1 2003 – Dec 31 2006 • Rainfall/Runoff/Routing: Daily Rain/Curve Number/Daily • Rainfall Distribution: Normal Skewed • Potential ET Method: Priestley-Taylor method • Channel Water Routing: Muskingum • Channel Degradation: Not Active • Stream Water Quality Processes: Active • Lake Water Quality Processes: Not Active • Printout Frequency: Monthly and Annually
Results 1. Land Area Phase
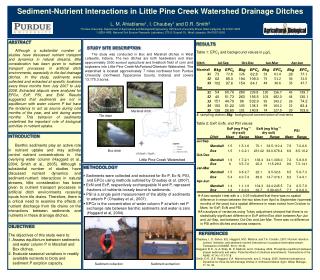
Sediment Yield (ton/ha/yr) Amprong River Basin Upper Lesti River Basin > 1.74 1.74 – 4.53 4.53 – 7.88 7.88 – 27.33 27.33 – 85.95
Organic N (kg N/ha) Upstream Brantas Bango River Basin
Organic P (kg P/ha) Bango River Basin
Annual Average Estimates of Sediment Yield and Nutrient Load for Each Basin Based on Period 1995 to 2006 Simulated
Annual Average Estimates of Nutrient Concentration in outlet stream for Each Basin Based on Period 1995 to 2006 Simulated
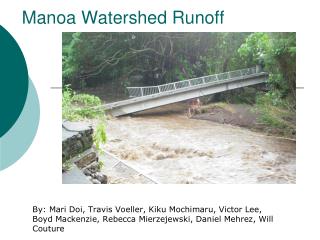
Conclusion • Banggo river basin is both highest of rainfall 2.043 mm and surface runoff 876.67 mm, respectively • The highest sediment yield is 85,94 ton/ha/year in Upper Lesti river basin due to maximum erosion rate • The concentration of organic P (range 0,36 – 0,99 mg/l) in all sub basin is over of the WQ standard regulation in C class. • The concentration of organic N (range 9,34 – 20,80 mg/l) in all sub basins is lower of the WQ standard regulation in C class. • The AVSWAT model was successes for assessment of runoff, sediment yield and nutrient load in Upper Brantas River Basin
Suggestion • The AVSWAT model would be testing to another watershed • In the next simulation, modification of difference fertilizer used and management tillage in agriculture would be done. • Simulation of SWAT model can also done which difference of divided of each sub basin which smaller than 200 km2.
Acknowledgement We would like to thank you the following for making this study possible: • Brawijaya University, Indonesia • University of Malaya, Malaysia • Perum Jasa Tirta I, Malang, Indonesia • Department of Agriculture, Indonesia • Department of Surveying, Indonesia