Download
1 / 41
410 likes | 514 Vues
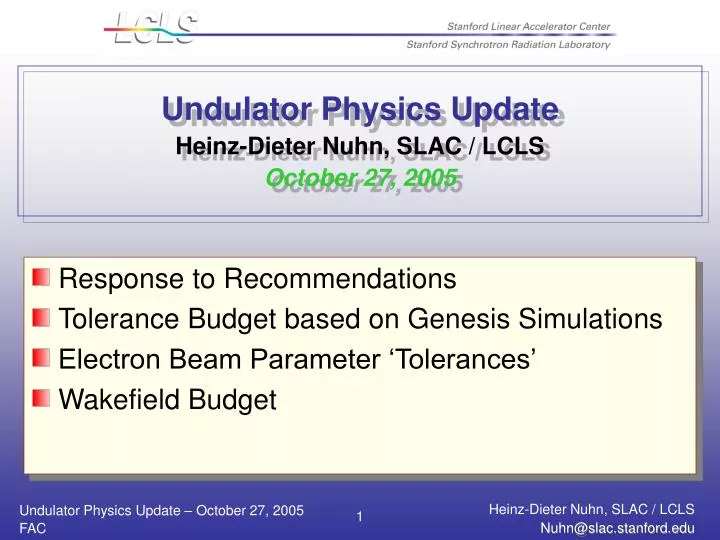
Undulator Physics Update Heinz-Dieter Nuhn, SLAC / LCLS October 27, 2005. Response to Recommendations Tolerance Budget based on Genesis Simulations Electron Beam Parameter ‘Tolerances’ Wakefield Budget. Response to FAC Recommendations. Response:

E N D
Undulator Physics UpdateHeinz-Dieter Nuhn, SLAC / LCLSOctober 27, 2005 • Response to Recommendations • Tolerance Budget based on Genesis Simulations • Electron Beam Parameter ‘Tolerances’ • Wakefield Budget 1
Response to FAC Recommendations Response: With regards to the undulator, Radiation Physics simulations have shown that OTR foils are not likely to cause a problem if designed and used properly. A foil of 10 microns thickness or less used for a few shots at a time will not cause a problem. The use of the foil will be interlocked to the MPS system. Also, bunches will not be allowed to enter the undulator area while the OTR foil is performing an insert or remove motion (indeterminate position). Presently, the plan for the undulator OTR foils is being reduced down to an R&D project. We are removing the funds for actually building and installing OTR foils in the undulator area from the base line. We will still have the ability to measure the x and y beam sizes at every undulator break by using the secondary function of the Beam Finder Wire (BFW). FAC April 2005 Recommendation: The radiation produced by scattering from OTR foils in the undulator is a concern. The Committee recommends that a plan be developed to minimize risk of damage to undulators from OTR screen use. 2
Response to FAC Recommendations Response: The need for the upstream beam monitor, i.e. the Beam Finder Wire (BFW), comes from the tight tolerances for positioning the electron beam on the undulator axis as defined during the tuning procedure. While this alignment can be achieved using a portable wire position monitor system, using such a system requires extended tunnel access during the commissioning process after a straight electron beam trajectory has been established with the beam-based alignment procedure. The BFW will provide a beam-based measurement, and allow this alignment task to be accomplished from the control room without the need for tunnel access. The portable wire position monitor system will serve as a backup. FAC April 2005 Recommendation: The procedure to align the undulator appears to be feasible and offers additional redundancy; however, the justification for an upstream beam monitor was not made clear. 3
Response to FAC Recommendations Response: We have studied more carefully the tolerances for alignment variations over both short and long term time-scales, and have devised an escalating series of beam-based correction levels, each with an associated time-scale and tolerable FEL power loss, as was suggested by the FAC in April 2005. The ‘bulls-eye’ diagram proposed by the FAC has been tagged “Kem’s Zones” and has been described in some detail in Paul Emma’s presentation. Briefly, the correction levels extend from shot-to-shot trajectory feedback systems, to hourly ‘micado’ steering algorithms, to daily weighted steering or ‘BBA-light’, to weekly BBA, and finally to semi-annual conventional alignment. The outcome of these studies has also served to define the tolerable trajectory drift errors over short term (BBA execution duration: 1 hr) and longer term (diurnal variations: 1 day). These tolerances are incorporated into the undulator Physics Requirements Document (PRD) 1.4-001 and serve as a guideline for the design of supports, temperature regulation, and BPM systems. FAC April 2005 Recommendation: Concern remains about the ground settlement and stability of the undulator hall floor. The Committee recommends that LCLS project physicists quantify the allowable ground motion given the range of instrumentation available, and provide specifications on ground motion based on realistic day-to-day alignment and periodic beam-based alignment. The physics analysis should include study of the extent to which the systems can accommodate movements beyond the survey tolerances. 4
Response to FAC Recommendations FAC April 2005 Recommendation: The very tight temperature tolerances in the undulator tunnel (+/- 0.2 C) have severe implications on controls. There are plans to put electronics in the ceiling air return duct where it will be difficult to maintain and concerns that the stepping motors will give off more heat than allowed. The air conditioning system necessary to maintain that temperature stability is also very expensive. The accelerator physicists should have a hard look to see if there is a way to increase this tolerance. Response: The temperature stability tolerances for the undulator tunnel have been re-examined both with respect to their influences on the undulator magnetic field as well as to the positional stability of the quadrupoles and BPMs. GENESIS simulations of the effects of errors of the average K values for each undulator segment, both random and systematic, show that temperature errors from a uniform distribution with a width of ±1 degree F (±0.56 degrees C) are consistent with a total overall error budget for a 25% reduction in FEL power (but not taking credit for simple undulator x-position adjustments to compensate temperature variations). In parallel, a thermal expansion study was carried out at the APS with the result that for temperature changes of ±0.5 degree C the critical components will stay with in the position tolerances (±5 microns over 24 hours). Based on these analyses, which will be presented during the next FAC meeting, the temperature tolerances for the undulator tunnel have been relaxed. The requirement specification says now: “The absolute temperature along the Undulator will stay within a range of 20±0.6 °C at all times.” 5
LCLS Undulator Tolerance Budget Analysis • Based On Time Dependent SASE Simulations in 2 Phases • Simulation Code: Genesis 1.3 • Simulate Individual Error Sources • Combine Results into Error Budget 6
Parameters for Tolerance Study • The following 8 errors are considered: • Beta-Function Mismatch, • Launch Position Error, • Module Detuning, • Module Offset in x, • Module Offset in y, • Quadrupole Gradient Error, • Transverse Quadrupole Offset, • Break Length Error. • The ‘observed’ parameter is the average of the FEL power at 90 m (around saturation) and 130 m (undulator exit) 7
Step I - Individual Study • Time-dependent runs with increasing error source (uniform distribution) and different error seeds. Gauss fit to obtain rms-dependence. Detailed Analysis Description 8
Step I – Error1b: Optics Mismatch Simulation and fit results of Optics Mismatch analysis. The larger amplitude data occur at the 114-m-point, the smaller amplitude data at the 80-m-point. Transformation from negative exponential to Gaussian: z < 1.41 Y. Ding Simulations 9
Comparison of z vs. b/b0 Simplifies at waist location: + - or, resolved for b 1-s value 10
Step I – Error 2: Transverse Beam Offset Simulation and fit results of Transverse Beam Offset (Launch Error) analysis. The larger amplitude data occur at the 130-m-point, the smaller amplitude data at the 90-m-point. S. Reiche Simulations 11
Step I – Error 3: Module Detuning Simulation and fit results of Module Detuning analysis. The larger amplitude data occur at the 130-m-point, the smaller amplitude data at the 90-m-point. Z. Huang Simulations 12
Step I – Error 4: Horizontal Module Offset Simulation and fit results of Horizontal Module Offset analysis. The larger amplitude data occur at the 130-m-point, the smaller amplitude data at the 90-m-point. S. Reiche Simulations 13
Step I – Error 5: Vertical Module Offset Simulation and fit results of Vertical Module Offset analysis. The larger amplitude data occur at the 130-m-point, the smaller amplitude data at the 90-m-point. S. Reiche Simulations 14
Step I – Error 6: Quad Field Variation Simulation and fit results of Quad Field Variation analysis. The larger amplitude data occur at the 130-m-point, the smaller amplitude data at the 90-m-point. S. Reiche Simulations 15
Step I – Error 7: Transverse Quad Offset Error Simulation and fit results of Transverse Quad Offset Error analysis. The larger amplitude data occur at the 130-m-point, the smaller amplitude data at the 90-m-point. S. Reiche Simulations 16
Step I – Error 8: Break Length Error Simulation and fit results of Break Length Error analysis. The larger amplitude data occur at the 130-m-point, the smaller amplitude data at the 90-m-point. S. Reiche Simulations 17
Step II - Tolerance Budget • Assuming that each error is independent on each other (validity of this assumption is limited) • Each should yield the same degradation • Tolerance is defined for a given power degradation tolerance fitted rms fi=xi/si unit weights n = 8 18
Step III - Correlated Error Sources • For the simplest approach, the tolerance budget assumes uncorrelated errors of 8 different sources. • Some tolerances (e.g. the break length error) are very relaxed and can be reduced to relax other tolerances, i.e. use individual tolerances. • Next step is to combine all error sources in the simulation. • Include BBA and other correction scheme in the runs 19
Step II - Tolerance Budget (cont’) z < 1.1 Can be mitigated through steering. 20
e- beam Tolerances Saturation after Undulator End Saturation after Undulator End 1.72 µm 2.57 kA 0.025 % 22
e--Beam Quality ‘Tolerance Budget’ Will keep saturation before undulator end Uses only half the saturation length budget 23
Wakefield Budget • Undulator Wakefield Sources: • Resistive Wall Wakefields (ac conductivity) => Main Contributor • Mitigation: Aluminum Surface, Rectangular Cross Section • Surface Roughness Wakefields • Mitigation: Limit roughness aspect ration to larger than 300. • Total contribution small compared to resistive wall wakefields • Geometric Wakefields • Sources: • Rectangular to Round Transition • BFW Replacement Chamber Mis-Alignment • RF Cavity BPMs • Bellows Shielding Slots • Flanges • Pump Slots • Total contribution small compared to resistive wall wakefields 24
Short Break Section Chamber Profile BFW Replacement Chamber Flange Gaps .5 mm RF Cavity Length 10 mm Bellows Shielding Slots Gaps 20 mm / 10% Pump Slot Chamber Diameter 8 mm Chamber Diameter 10 mm Undulator Chamber 5x10 mm Undulator Chamber 5x10 mm There are now 5 flanges per short break section 25
Long Break Section Chamber Profile BFW Replacement Chamber Flange Gaps .5 mm Bellows Shielding Slots Gaps 20 mm / 10% RF Cavity Length 10 mm Chamber Diameter 8 mm Chamber Diameter 10 mm Undulator Chamber 5x10 mm Undulator Chamber 5x10 mm Pump Slot 26 Courtesy of Dean Walters
Geometric Wakefield Budget Summary Beam Energy = 13.64 GeV Undulator Length = 132 m Charge = 1 nC Core Charge = 0.45 nC 27
Transition Model Wake Field Summary Total Bunch: <Wt> = -82.2 keV/m (-0.080 %) Wt,rms = 50.7 keV/m ( 0.049 %) Bunch Core: <Wc> = -42.5 keV/m (-0.041 %) Wc,rms = 4.4 keV/m ( 0.004 %) r -> 52.0 keV/m 28
Diffraction Model Wake Field Summary Total Bunch: <Wt> = -26.6 keV/m (-0.026 %) Wt,rms = 9.9 keV/m ( 0.009 %) Bunch Core: <Wc> = -23.2 keV/m (-0.041 %) Wc,rms = 2.7 keV/m ( 0.004 %) 29
Surface Roughness Wake Field Summary Aspect Ratio 300 Total Bunch: <Wt> = -13.0 keV/m (-0.013 %) Wt,rms = 26.9 keV/m ( 0.026 %) Bunch Core: <Wc> = 2.9 keV/m ( 0.003 %) Wc,rms = 4.6 keV/m ( 0.004 %) 30
Resistive Wall Wake Field Summary AC Conductivity Al, parallel plates Total Bunch: <Wt> = -82.6 keV/m (-0.080 %) Wt,rms = 88.1 keV/m ( 0.085 %) Bunch Core: <Wc> = -36.1 keV/m (-0.035 %) Wc,rms = 79.8 keV/m ( 0.077 %) 31
Total Wake Field Summary Total Bunch: <Wt> =-204.3 keV/m (-0.198 %) Wt,rms = 127.2 keV/m ( 0.123 %) Bunch Core: <Wc> = -98.8 keV/m (-0.096 %) Wc,rms = 78.3 keV/m ( 0.076 %) r -> 52.0 keV/m 32
Total Wake Budget Summary Beam Energy = 13.64 GeV Undulator Length = 132 m Charge = 1 nC Charge = 1 nC Core Charge = 0.45 nC 33
GENESIS Simulated S. Reiche Simulations 34
no wake Al + 200 kV/m Al S. Reiche Simulations 35
Al + 200 kV/m no wake Al S. Reiche Simulations 36
Summary • An undulator tolerance budget analysis based on GENESIS simulations was presented. • Several critical tolerances have been relaxed: • Temperature Stability is now 0.56oC (was 0.1oC) • Vertical Segment Alignment is now 80 µm (was 70 µm) rms • Short Term (1hr ) Quadrupole Stability 2 µm (was 1 µm in 10 hrs) • Long Term (24hrs ) Quadrupole Stability 5 µm • An undulator wakefield budget analysis is used to keep track of the various wakefield sources during the component design phase. 40