Download
1 / 25
250 likes | 375 Vues
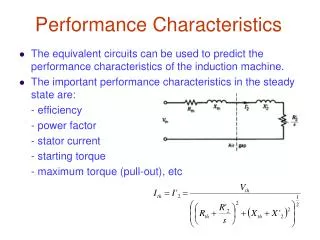
2011-12 Bentonville School District Characteristics and Performance. November 19, 2012 Gary W. Ritter Director Office for Education Policy. Overview of Today’s Presentation. Introduction to the OEP.

E N D
2011-12 Bentonville School District Characteristics and Performance November 19, 2012 Gary W. Ritter Director Office for Education Policy OEP Presentation on School Ratings
Overview of Today’s Presentation • Introduction to the OEP. • A brief look back at the 2011 Northwest AR Report Card, with a focus on Bentonville student subgroup performance. • Highlighting 2012 Bentonville School District Subgroup Performance (Elem & Middle Grades). • Introduction to OEP’s Similar Schools/Districts Group & the Similar Schools/Districts Rating. • Comparing Bentonville Schools to Similar Schools. • Solicitation of feedback. www.uark.edu/ua/oep
AR Education Reports • Policy Briefs • Report Cards • Newsletters • Data Resources OEP is a research center within the College of Education and Health Professions at the University of Arkansas that specializes in Education Research and Policy. www.uark.edu/ua/oep
2011 Northwest Arkansas Report Card The 2011 NWA Report Card highlighted test scores, achievement gaps, graduation rates, and teacher salary for the 2010-11 academic year. Similar to our state Arkansas Report Card, The NWA Report Card was created to provide more detailed information specific to the Northwest Arkansas regionsuch as: Overview of Assessments NWA Characteristics District by District Performance on Standardized Assessments (Over Time) Diverse Subgroups Secondary and Beyond www.uark.edu/ua/oep
AR Benchmark Math Exam % Proficient or Advanced (Elementary) by Race, 2010 AR Benchmark Math Exam % Proficient or Advanced (Middle) by Race, 2010 www.uark.edu/ua/oep
AR Benchmark Literacy Exam % Proficient or Advanced (Elementary) by Race, 2010 AR Benchmark Literacy Exam % Proficient or Advanced (Middle) by Race, 2010 www.uark.edu/ua/oep
Diverse Subgroups: Poverty & Language Barriers www.uark.edu/ua/oep
AR Benchmark Math Exam % Proficient or Advanced (Elementary), FRL & LEP, 2010 AR Benchmark Math Exam % Proficient or Advanced (Middle), FRL & LEP, 2010 www.uark.edu/ua/oep
AR Benchmark Literacy Exam % Proficient or Advanced (Elementary), FRL & LEP, 2010 AR Benchmark Literacy Exam % Proficient or Advanced (Middle), FRL & LEP, 2010 www.uark.edu/ua/oep
2012 Northwest Arkansas Report Card The 2012 NWA Report Card also highlights test scores, achievement gaps, graduation rates, and teacher salary for the 2011-12 academic year. However, some additional variables are presented in this year’s Report Card such as economic indicators, and higher education data. However, today we will only highlight Bentonville Schools www.uark.edu/ua/oep
2012 NWA Report Card: Focus on Bentonville SD On the Arkansas Benchmark Exam, the Bentonville School District scored high among other Northwest AR districts with:91% of students P/A in Math90% of Students P/A in Literacy www.uark.edu/ua/oep
2012 NWA Report Card: Focus on Bentonville SD On the Iowa Test of Basic Skills, the Bentonville School District scored high among other Northwest AR school districts scoring at the 69th National Percentile Rank www.uark.edu/ua/oep
Next, we will look at how subgroups within the “Big 5” School Districts performed on the 2011-12 Benchmark Exams in Math and Literacy Specifically, we look at performance of: FRL students Non-FRL Students African American Students Hispanic Students www.uark.edu/ua/oep
AR Benchmark Math Exam % Proficient or Advanced (Elementary), Select Subgroups, 2012 AR Benchmark Math Exam % Proficient or Advanced (Middle), Select Subgroups, 2012 www.uark.edu/ua/oep
AR Benchmark Literacy Exam % Proficient or Advanced (Elementary), Select Subgroups, 2012 AR Benchmark Literacy Exam % Proficient or Advanced (Middle), Select Subgroups, 2012 www.uark.edu/ua/oep
2012 NWA Report Card: Focus on Bentonville SD On the End of Course Exams, Bentonville School District students outscored all other Northwest AR districts. Bentonville SD also boasts the highest graduation rate in NWA. www.uark.edu/ua/oep
Snapshot: Bentonville Schools - Demographics www.uark.edu/ua/oep
Snapshot: Bentonville Schools – Benchmark and ITBS Test Scores www.uark.edu/ua/oep
The Similar Schools Group • Because it makes little sense to compare performance of Bentonville High to, say, KIPP Delta, the OEP developed a school grouping procedure to compare similar schools. • For example, we grouped schools according to the grades served: (1=primary, 2=elementary, 3=middle, 4=junior high) AND the fraction of economically disadvantaged students at the school (measured by the number of students receiving a free or reduced-price lunch – FRL) grouped into three categories: (1 = low economic disadvantage, 2 = middle economic disadvantage, and 3 = high economicdisadvantage). • Let’s say, we want to compare how Randall G. Lynch Middle School in Farmington performs on the benchmark to other schools that “look like” Randall G. Lynch Middle. How do we do that? We find other middle schools with similar percentages of FRL students. • Randall G. Lynch is a “middle school,” thus it is classified as a “3” • Randall G. Lynch has a low FRL%, thus it is classified as a “1” • Therefore, Randall G. Lynch is in the similar schools group 3.1 • We can now compare Lynch with all other schools that are in the 3.1 grouping www.uark.edu/ua/oep
Snapshot: Bentonville Schools – Comparison to Similar Schools www.uark.edu/ua/oep
Comparing Bentonville Middle Schools Comparing Bentonville Elementary Schools www.uark.edu/ua/oep
Snapshot: Bentonville Schools – Accountability Status, 2010 www.uark.edu/ua/oep
Questions or Comments? www.uark.edu/ua/oep
office for education policy 201 Graduate Education Building College of Education and Health Professions | University of Arkansas Fayetteville | AR | 72701 | Ph: 479/575-3773 | Fax: 479/575-3196 e-mail: oep@uark.edu OEP is a research center within the College of Education and Health Professions at the University of Arkansas that specializes in Education Research and Policy. www.uark.edu/ua/oep www.uark.edu/ua/oep


![AEIS 2011-12 [Our School District]](https://cdn0.slideserve.com/1410769/aeis-2011-12-our-school-district-dt.jpg)


![Adequate Yearly Progress 2011-12 [Our School District]](https://cdn1.slideserve.com/2441722/adequate-yearly-progress-2011-12-our-school-district-dt.jpg)