Download
1 / 26
1.12k likes | 5.21k Vues
Demand Forecasting. General considerations: Factors involved in demand forecasting Purposes of forecasting Determinants of demand Length of forecasts Forecasting demand for new products Criteria of a good forecasting method Presentation of a forecast to the management

E N D
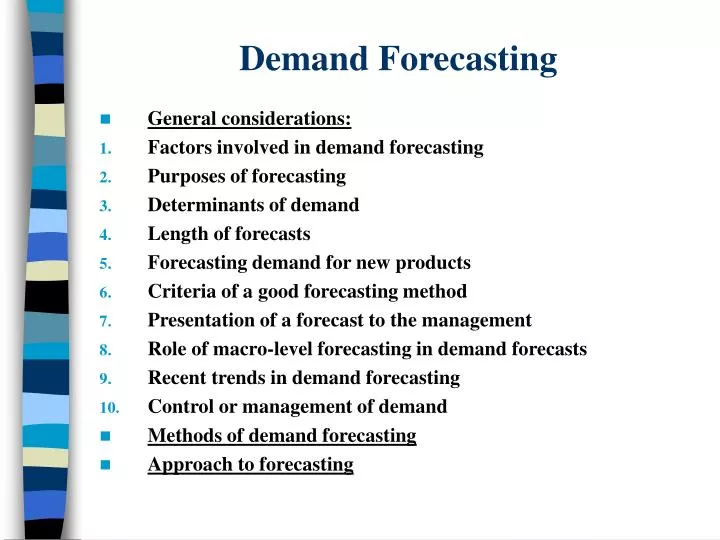
Demand Forecasting • General considerations: • Factors involved in demand forecasting • Purposes of forecasting • Determinants of demand • Length of forecasts • Forecasting demand for new products • Criteria of a good forecasting method • Presentation of a forecast to the management • Role of macro-level forecasting in demand forecasts • Recent trends in demand forecasting • Control or management of demand • Methods of demand forecasting • Approach to forecasting
Demand Forecasting Accurate demand forecasting is essential for a firm to enable it to produce the required quantities at the right time and arrange well in advance for the various factors of production, viz., raw materials, equipment, machine accessories, labour, buildings, etc. In a developing economy like India, supple forecasting seems more important. However, the situation is changing rapidly. The National Council of Applied Economic Research. Factors involved in Demand Forecasting • How far ahead? a. Long term – eg., petroleum, paper, shipping. Tactical decisions. Within the limits of resources already available. b. Short-term – eg., clothes. Strategic decisions. Extending or reducing the limits of resources.
Factors involved in Demand Forecasting 2.Undertaken at three levels: • Macro-level • Industry level eg., trade associations • Firm level 3. Should the forecast be general or specific (product-wise)? 4. Problems or methods of forecasting for “new” vis-à-vis “well established” products. 5. Classification of products – producer goods, consumer durables, consumer goods, services. 6. Special factors peculiar to the product and the market – risk and uncertainty. (eg., ladies’ dresses)
Purposes of forecasting • Purposes of short-term forecasting • Appropriate production scheduling. • Reducing costs of purchasing raw materials. • Determining appropriate price policy • Setting sales targets and establishing controls and incentives. • Evolving a suitable advertising and promotional campaign. • Forecasting short term financial requirements. • Purposes of long-term forecasting • Planning of a new unit or expansion of an existing unit. • Planning long term financial requirements. • Planning man-power requirements. Demand forecasts of particular products form guidelines for related industries (eg., cotton and textiles). Also helpful at the macro level.
Determinants of Demand 1. Non-durable consumer goods: A. Purchasing power – disposable personal income (personal income – direct taxes and other deductions). Published by C.S.O. Discretionary income :Disposable income less (a) imputed income and income in kind, (b) major fixed outlay payments, (c ) essential expenditures such as food and clothing. B. Price. C. Demography: d= f (Y, D, P) Eg., cotton cloth vs. cost of food grain. 2. Durable consumer goods: A. Choice between (a) using the goods longer by repairing it, or (b) disposing it off and replacing it with a new one.
Determinants of Demand B. Require special facilities for their use, eg., roads for automobiles. C. Household demand vis-à-vis individual demand. D. Family characteristics. E. Total demand consists of a. New-owner demand and, b. Replacement demand (scrappage rate) F. Price and credit conditions. 3. Capital goods: – used for further production. Demand will depend upon the specific markets they serve and the end uses for which they are bought. Data required for estimating the demand for capital goods: • The growth prospects of the user industries. • The norm of consumption of capital goods per unit of installed capacity. • The velocity of their use.
Length of forecasts • Short-term forecasts – upto 12 months, eg., sales quotas, inventory control, production schedules, planning cash flows, budgeting. • Medium-term – 1-2 years, eg., rate of maintenance, schedule of operations, budgetary control over expenses. • Long-term – 3-10 years, eg., capital expenditures, personnel requirements, financial requirements, raw material requirements. (Most uncertain in nature) Forecasting demand for new products – Joel Dean • Project the demand for a new product as an outgrowth of an existing old product. • Analyse the new product as a substitute for some existing product or service. • Estimate the rate of growth and the ultimate level of demand for the new product on the basis of the pattern of growth of established products.
Forecasting demand for new products 4. Estimate the demand by making direct enquiries from the ultimate purchasers, either by the use of samples or on a full scale. 5. Offer the new product for sale in a sample market, eg., by direct mail or through one multiple shop organisation. 6. Survey consumers’ reactions to a new product indirectly through the eyes of specialised dealers who are supposed to be informed about consumers’ need and alternative opportunities. Criteria of a good forecasting method • Accuracy – measured by (a) degree of deviations between forecasts and actuals, and (b) the extent of success in forecasting directional changes. • Simplicity and ease of comprehension. • Economy. • Availability. • Maintenance of timeliness.
Presentation of a forecast to the Management • In presenting a forecast to the management, a managerial economist should: • Make the forecast as easy for the management to understand as possible. • Avoid using vague generalities. • Always pin-point the major assumptions and sources. • Give the possible margin of error. • Avoid making undue qualifications. • Omit details about methodology and calculations. • Make use of charts and graphs as much as possible for easy comprehension.
Role of Macro-level forecasting in demand forecasts • Various macro parameters found useful for demand forecasting: • National income and per capita income. • Savings. • Investment. • Population growth. • Government expenditure. • Taxation. • Credit policy.
Recent trends in demand forecasting 1. More firms are giving importance to demand forecasting than a decade ago. 2. Since forecasting requires close cooperation and consultation with many specialists, a team spirit has developed. 3. Better kind of data and improved forecasting techniques have been developed. 4. There is a greater emphasis on sophisticated techniques such as using computers. 5. New products’ forecasting is still in infancy. 6. Forecasts are usually broken down in monthly forecasts. 7. In spite of the application of newer and modern techniques, demand forecasts are still not too accurate. 8. The usefulness of personal feel or subjective touch has been accepted. 9. Top-down approach is more popular then bottom-up approach.
Control or management of demand • The key to management of demand is the effective management of the purchases of final consumers. • The management of demand consists in devising a sales strategy for a particular product. It also consists in devising a product, or features of a product, around which a sales strategy can be built. Product design, model change, packaging and even performance reflect the need to provide what are called strong selling points.
Methods of demand forecasting • Survey of buyers’ intentions • Delphi method • Expert opinion • Collective opinion • Naïve models • Smoothing techniques • Moving average • Exponential smoothing • Analysis of time series and trend projections • Use of economic indicators • Controlled experiments • Judgemental approach
Methods of demand forecasting Though statistical techniques are essential in clarifying relationships and providing techniques of analysis, they are not substitutes for judgement. What is needed is some common sense mean between pure guessing and too much mathematics. 1. Survey of buyers’ intentions: also known as Opinion surveys. Useful when customers are industrial producers. (However, a number of biases may creep up). Not very useful for household consumers. Limitation: passive and “does not expose and measure the variables under management’s control” 2. Delphi method: it consists of an effort to arrive at a consensus in an uncertain area by questioning a group of experts repeatedly until the results appear to converge along a single line of the issues causing disagreement are clearly defined. Developed by Rand Corporation of the U.S.A in 1940s by Olaf Helmer, Dalkey and Gordon. Useful in technological forecasting (non-economic variables).
Delphi method Advantages • Facilitates the maintenance of anonymity of the respondent’s identity throughout the course. • Saves time and other resources in approaching a large number of experts for their views. Limitations/presumptions: • Panelists must be rich in their expertise, possess wide knowledge and experience of the subject and have an aptitude and earnest disposition towards the participants. • Presupposes that its conductors are objective in their job, possess ample abilities to conceptualize the problems for discussion, generate considerable thinking, stimulate dialogue among panelists and make inferential analysis of the multitudinal views of the participants.
3. Expert opinion / “hunch” method To ask “experts in the field” to provide estimates, eg., dealers, industry analysts, specialist marketing consultants, etc. Advantages: • Very simple and quick method. • No danger of a “group-think” mentality. 4. Collective opinion method Also called “sales force polling”, salesmen are required to estimate expected sales in their respective territories and sections. Advantages: • Simple – no statistical techniques. • Based on first hand knowledge. • Quite useful in forecasting sales of new products. Disadvantages: • Almost completely subjective. • Usefulness restricted to short-term forecasting. • Salesmen may be unaware of broader economic changes.
5. Naïve models Naïve forecasting models are based exclusively on historical observation of sales (or other variables such as earnings, cash flows, etc). They do not explain the underlying casual relationships which produces the variable being forecast. Advantage: Inexpensive to develop, store data and operate. Disadvantage: does not consider any possible causal relationships that underlie the forecasted variable. 3-naïve models 1. To use actual sales of the current period as the forecast for the next period; then, Yt+1 = Yt 2. If we consider trends, then, Yt+1 = Yt + (Yt – Yt-1) 3. If we want to incorporate the rate of change, rather than the absolute amount; then, Yt+1 = Yt (Yt / Yt-1)
6. Smoothing techniques Higher form of naïve models: A. Moving average: are averages that are updated as new information is received. With the moving average a manager simply employs, the most recent observations, drops the oldest observation, in the earlier calculation and calculates an average which is used as the forecast for the next period. Limitations: • One has to retain a great deal of data. • All data in the sample are weighed equally. B. Exponential smoothing: uses weighted average of past data as the basis for a forecast. Yt+1 = aYt + (1-a) Yt or Y new = a Y old + (1-a) Y’ old, where, Y new = exponentially smoothed average to be used as the forecast Y old = most recent actual data Y’old = most recent smoothed forecast a = smoothing constant Smoothing constant (or weight) has a value between 0 and 1 inclusive.
Exponential smoothing • The following rules of thumb may be given : • When the magnitude of the random variations is large, give a lower value to “a” so as to average out the effects of the random variation quickly. • When the magnitude of the random variation is moderate, a large value can be assigned to the smoothing constant “a”. • It has been found appropriate to have “a” between 0.1 and 0.2 in many systems. Advantages: Exponential smoothing is a forecasting method easy to use and efficiently handled by computers. Although a type of moving average technique, it requires very little record keeping of past data. This method has been successfully applied by banks, manufacturing companies, wholesalers and other organizations.
7. Analysis of time series and trend projections • The time series relating to sales represent the past pattern of effective demand for a particular product. Such data can be presented either in a tabular form or graphically for further analysis. The most popular method of analysis of the time series is to project the trend of the time series.a trend line can be fitted through a series either visually or by means of statistical techniques. The analyst chooses a plausible algebraic relation (linear, quadratic, logarithmic, etc.) between sales and the independent variable, time. The trend line is then projected into the future by extrapolation. • Popular because: simple, inexpensive, time series data often exhibit a persistent growth trend. • Disadvantage: this technique yields acceptable results so long as the time series shows a persistent tendency to move in the same direction. Whenever a turning point occurs, however, the trend projection breaks down. The real challenge of forecasting is in the prediction of turning points rather than in the projection of trends.
Analysis of time series and trend projections • Four sets of factors: secular trend (T), seasonal variation (S), cyclical fluctuations (C ), irregular or random forces (I). O (observations) = TSCI Assumptions: • The analysis of movements would be in the order of trend, seasonal variations and cyclical changes. • Effects of each component are independent of each other.
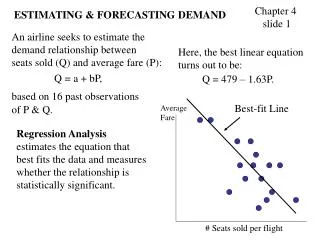
8. Use of economic indicators The use of this approach bases demand forecasting on certain economic indicators, eg., • Construction contracts sanctioned for the demand of building materials, say, cement; • Personal income for the demand of consumer goods; • Agricultural income for the demand of agricultural inputs, implements, fertilizers, etc,; and • Automobile registration for the demand of car accessories, petrol, etc. Steps for economic indicators: • See whether a relationship exists between the demand for the product and certain economic indicators. • Establish the relationship through the method of least squares and derive the regression equation. (Y= a + bx) • Once regression equation is derived, the value of Y (demand) can be estimated for any given value of x. • Past relationships may not recur. Hence, need for value judgement.
Use of economic indicators • Limitations: • Finding an appropriate economic indicator may be difficult. • For new products – no past data exists. • Works best when the relationship of demand with a particular indicator is characterized by a time lag. Eg., construction contracts will result in a demand for building materials but with a certain amount of time lag.
9. Controlled experiments • Under this method, an effort is made to vary separately certain determinants of demand which can be manipulated, e.g., price, advertising, etc., and conduct the experiments assuming that the other factors remain constant. • Example – Parker Pen Co. • Still relatively new and untried: • Experiments are expensive as well as time consuming. • Risky – may lead to unfavourable reaction on dealers, consumers, competitors, etc. • Great difficulty in planning the study.difficult to satisfy the condition of homogeneity of markets.
10. Judgemental approach • Required when: • Analysis of time series and trend projections is not feasible because of wide fluctuations in sales or because of anticipated changes in trends; and • Use of regression method is not possible because of lack of historical data or because of management’s inability to predict or even identify causal factors. Even statistical methods require supplementation of judgement: • Even the most sophisticated statistical methods cannot incorporate all the potential factors, e.g., a major technological breakthrough in product or process design. • For industrial products – if the management anticipates loss or addition of few large buyers, it could be taken into account only through judgement approach. • Statistical forecasts are more reliable for larger levels of aggregations.
Approach to forecasting 1. Identify and clearly state the objectives of forecasting. 2. Select appropriate method of forecasting. 3. Identify the variables. 4. Gather relevant data. 5. Determine the most probable relationship. 6. For forecasting the company’s share in the demand, two different assumptions may be made: • Ratio of company sales to the total industry sales will continue as in the past. • On the basis of an analysis of likely competition and industry trends, the company may assume a market share different from that of the past. (alternative / rolling forecasts) 7. Forecasts may be made either in terms of units or sales in rupees. 8. May be made in terms of product groups and then broken for individual products. 9. May be made on annual basis and then divided month-wise, etc.