Download
1 / 8
90 likes | 217 Vues
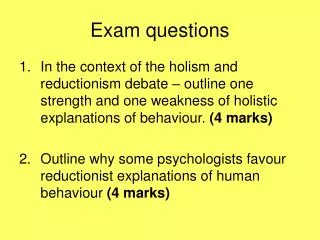
Exam 3 Questions. 1. Test statistic t=1.79, n=33. Find and interpret the P-value. 2. Find the critical value(s) for a one-tail hypothesis test with and a 0.10 significance level.

E N D
1. Test statistic t=1.79, n=33. Find and interpret the P-value. 2. Find the critical value(s) for a one-tail hypothesis test with and a 0.10 significance level. 3. For a confidence interval on the proportion of college students that have children, John found that E=.12. Interpret his margin of error.
4. Original claim: The mean height of NBA basketball players is at least 6 feet 8 inches. What are the null and alternative hypotheses? 5. Original claim: The mean height of NBA basketball players is at least 6 feet 8 inches. Initial conclusion is reject the null. State the final conclusion in simple nontechnical terms.
6. Claim: The proportion of male students born in the last half of the year is less than the proportion of female students born in the last half of the year. Use a 0.10 significance level. Data: from MTH 243 students Total students Born in last 6 months Male: 18 8 Female: 21 14
7. You have developed a new drug and you claim that it lowers cholesterol, so you express the claim as , where 100 is a standardized index of cholesterol. Which P-value would you prefer to get: 0.04 or 0.01? Why?
8. Consumers will spend an estimated average of $483 on merchandise for back to school spending based on a survey of 8453 consumers with a margin of error of plus or minus 1 percentage point. What is wrong with this statement?
9. We wish to conduct a poll to determine the percent of adults who feel that bars should refuse service to patrons who dance on the tables. If we wish to be 95% confident that the margin of error is 2%, how large should my sample be?
10. Discuss two different triggers for rejecting a null hypothesis. 11. What is the difference between a test statistic and a critical value? 12. What is the difference between an alpha and a P-value.


![SUBELEMENT T3 [3 Exam Questions - 3 Groups]](https://cdn0.slideserve.com/436315/subelement-t3-3-exam-questions-3-groups-dt.jpg)
![G5 - ELECTRICAL PRINCIPLES [3 exam questions - 3 groups]](https://cdn0.slideserve.com/589616/g5-electrical-principles-3-exam-questions-3-groups-dt.jpg)
![SUBELEMENT T0 [3 Exam Questions - 3 Groups]](https://cdn0.slideserve.com/706735/subelement-t0-3-exam-questions-3-groups-dt.jpg)

![G5 - ELECTRICAL PRINCIPLES [3 exam questions - 3 groups]](https://cdn5.slideserve.com/9521959/g5-electrical-principles-3-exam-questions-3-groups-dt.jpg)