Download
1 / 31
310 likes | 320 Vues
May 21, 2019. 3D Highway Design Model Benefit Cost Analysis NRRA Pavement Workshop. Jon Gustafson - WSP. Outline. Background Results of Surveys and Interviews Statistical Analysis of Historical Data Return-on-Investment (ROI) Recommendations and Conclusions. Objectives.

E N D
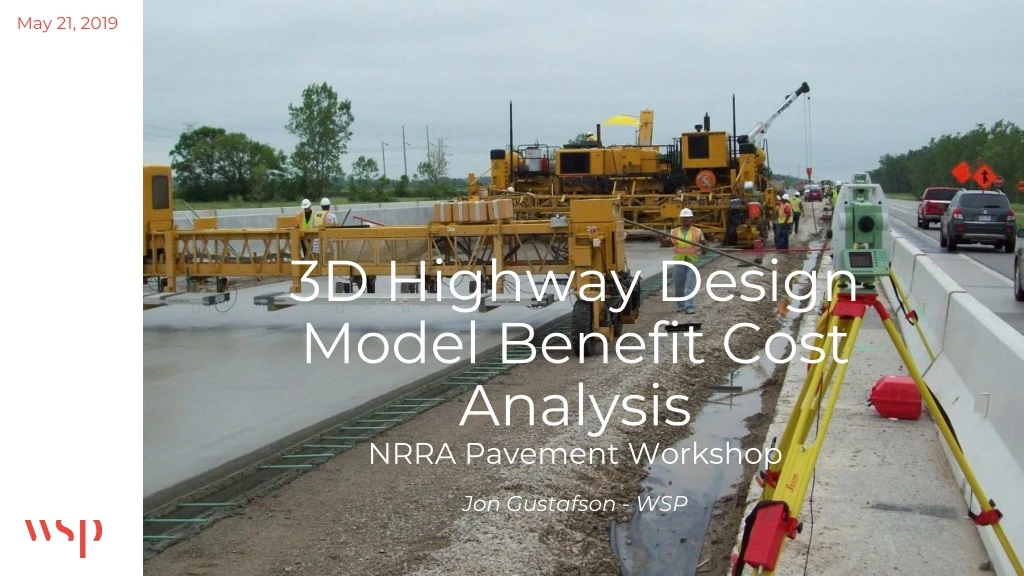
May 21, 2019 3D Highway Design Model Benefit Cost AnalysisNRRA Pavement Workshop Jon Gustafson - WSP
Outline At a glance Background Results of Surveys and Interviews Statistical Analysis of Historical Data Return-on-Investment (ROI) Recommendations and Conclusions
Objectives At a glance Document use of 3D models as RID Quantify costs and benefits to calculate ROI Find ways to streamline plan production Improve downstream use of elements from contractual 3D models Analyze potential and actual risk reduction
Results of Surveys and InterviewsHow do you use RID 3D models? • Satisfied with quality of RID 3D models • AMG construction equipment • Performing QTO for bidding • Compare RID files to plans • Validating independent 3D models • Determine storage locations • Creating 4D models • Constructability reviews with MDOT staff • Computing earthwork and subbase quantities • Evaluating right-of-way impacts • Establishing slope stake lines and construction layout • Developing detail grades and clearances • Checking drainage design items Contractors Feedback Design Firms Feedback
Estimators spend less time in QTO Better understanding of design intent Cost between 0.5 and 3% of overall construction contract value RID 3D models save between 25-50% time to create AMG models ($750/mile) AMG for earthwork saves 30-40% on production cost Cost to produce RID 3D models and plans is <10% of design contract (or 1% of construction contract) Results of Surveys and InterviewsFinancial Impact Contractor Feedback Design Firm Feedback
Software Packages Used • Agtek • AutoCAD/C3D • Carlson • MicroStation/Geopak/ PowerGEOPAK • Leica Captivate • Topcon Magnet • Trimble Business Center • Beneficial or Essential Files • LandXML for alignments, profiles and surfaces • DGN files • Software Used • MicroStation/Geopak • Autodesk (outside of DOT) • Geotechnical information • Digital Data Delivered (DB)* • 3D surfaces • 3D line strings • Coordinate geometry *LandXML, DGN, DWG Results of Surveys and InterviewsSoftware and File Types Contractors Feedback Design Firms Feedback
Finished surface and all pavement layers without the side slope conditions Results of Surveys and InterviewsContractor Feedback • What type of information should be included in the model? All detailed information, including all pavement layers and side slopes Only the top finished surface with/without shoulders and side slope conditions
Use special provision Consider industry learning curve Suggest experience QA staff for certifying grades Simply/eliminate horizontal alignment, pavement marking and signing sheets Model without proper documentation is high risk Consider updating compensation based model-centric milestones Accelerated timelines don’t allow for proper reviews Consider compensation for duplicate effort to finish contract plans & models Suggest defining authorized uses for the models Results of Surveys and InterviewsConsiderations for making 3D models contractual Contractor Feedback Design Firm Feedback
What items take the longest to develop for the RID process: • Proposed finish grade surface • Alternate surfaces (e.g. subbase) • 3D line string • Drainage networks and structures • Utilities and cross sections • Unique areas where geometry is not simple (e.g. roundabouts) Results of Surveys and InterviewsConsiderations for making 3D models contractual
Respondents indicated that LOD will drive what elements could become contractual. • Alignments & profiles could be contractual right away • Proposed finished grade surface and 3D line string features could become contractual ONLY if LOD was defined Results of Surveys and InterviewsConsiderations for making 3D models contractual
Major challenges identified with AMG projects • Consistent coordination with the contractor • Lack of guidance and established processes for managing digital data • Either inadequate tools and training to work with 3D models • Sometimes inaccurate representation of existing conditions • Benefits of 3D models and RID • Less change orders and claims avoidance • Improved safety • Allow to achieve aggressive timelines Results of Surveys and InterviewsMDOT Construction Staff Feedback
Does the use of 3D models as RID result in overall lower bid prices when compared with those projects using traditional 2D plans? • How do 3D models as RID compare with conventional 2D plans in establishing accurate project estimates • Given the variability in site conditions and project scope of work among the projects, is the observed evidence consistent enough to conclude that the use of 3D models as RID results in significant financial benefits to MDOT? Statistical Analysis of Historical DataHypothesis Testing and Analysis Approach
Statistical Analysis of Historical DataDefinitions of Metrics
To compare the metrics for two population samples • RID 3D model projects • 2D plan sheet projects • Outliers • Started 261 total projects • Outliers identified by a computation of interquartile range Statistical Analysis of Historical DataMethod of Analysis -Outliers
Statistical Analysis of Historical DataMethod of Analysis – Population Samples • Table 5. Population samples used in the hypothesis testing for cost growth. Table 4. Population samples used in the hypothesis testing for award growth.
Statistical Analysis of Historical DataMethod of Analysis – Award and Cost Growth
Statistical Analysis of Historical DataMethod of Analysis – Results Table 15. Award growth results by project size (statewide)1 Table 16. Cost growth results by project size1. 1 The benchmark is the engineer’s estimate. 2 Hypothesis testing using T-tests was not conducted as the sample size was too small to draw reasonable conclusions. • 1 The benchmark is the project award amount. • 2 The cost growth for this project size is more favorable to 2D plans. • 3 Hypothesis testing using T-tests was not conducted as the sample size was too small to draw reasonable conclusions.
Statistical Analysis of Historical DataMethod of Analysis – Results Table 17. Overall cost savings and overruns of 3D models versus 2D plans (millions of dollars, statewide). Note: Totals may not add due to rounding. Table 18. Summary of overall calculated benefits of 3D models versus 2D plans (millions of dollars, statewide)
Statistical Analysis of Historical DataMethod of Analysis – Missed Opportunities Table 19. Design elements identified as high or low risk.
ROI FrameworkSpreadsheet • Cost categories • Benefit categories • Other benefits to consider (not captured in study)
Recommendations and ConclusionsOutreach, Education, and Multi-disciplinary Collaboration • Outreach to educate internal and external stakeholders • When does digital data works well (use cases)? • What tools are available to produce, view and share information? • How do we get there together? • Establish a framework for multi-disciplinary collaboration • Collaborative milestone review (clash detection, constructability) • Data exchanges between disciplines (survey, design, bridge, hydraulics, etc.) • Develop training for construction inspection digital processes • Data, tools, processes, and people.
Recommendations and ConclusionsOutreach, Education, and Multi-disciplinary Collaboration Table 22. Recommendations for development of core knowledge area topics and training framework.
Recommendations and ConclusionsFramework for Contractual 3D Model Requirements General Requirements Model Development Specifications Data Management Guidelines Special Provisions Lean Processes
Recommendations and ConclusionsFramework for Contractual 3D Model Requirements
Recommendations and ConclusionsFramework for Contractual 3D Model Requirements
Research Team: WSP (Alexa Mitchell – PI, Elyssa Gensib, Dr. Suri Sadasivam, Jon Gustafson, and Tim Day) SSI (Jeff Bartlett, and Todd Bonzelet) Acknowledgements
Thank You Principal Investigator: Alexa Mitchell (WSP) Alexa.Mitchell@wsp.com Investigator: Jon Gustafson (WSP) Jon.Gustafson@wsp.com