Download
1 / 24
240 likes | 350 Vues
KMartin Works Research, Reports, Analytics and more. Building a Better Needs Assessment :. How to go from Good to G reat Assessments. What is the difference between a good and great community a ssessment The steps to follow to make your assessment great

E N D
KMartin Works Research, Reports, Analytics and more Building a Better Needs Assessment: How to go from Good to Great Assessments
What is the difference between a good and great community assessment The steps to follow to make your assessment great ‘How to’ examples and tips to complete these steps What are going to cover today
Includes a community profile Includes a client profile Reports on level of poverty, unemployment, housing, higher education, etc. in your community Lists community indicators (data) that support running the programs funded by the CAP Usually reports on client input on the CAP programs- quality, value, priority, etc. What are the components of a Good Assessment?
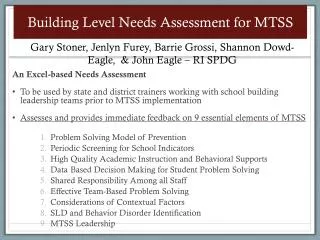
Gets data and insights from clients that are not available anywhere else Has data that allows a compare and contrast from your community population and your target population Data is drilled down to a small enough geographic or sub-population level to sufficiently understand and describe key need characteristics Data is provided in easily understood format – charts, maps, etc. that goes beyond narrative and tables. Does an analysis that shares insights in how to most effectively and efficiently design and deliver a path out of poverty for your target population Includes local emerging issues and ties these issues to national or state emerging issues affecting those in poverty What is included in a Great Assessment?
Planning Execution Using Great Data How do get a Great Assessment?
Two phases in planning: planning the scope & planning the data collection • Define what is the scope of what you want to assess • The more comprehensive the scope of the assessment the better the completed assessment will be, but the trickier the planning will be • Detail every step that needs to be taken in completing the data collection for the assessment – assign a person responsible, timeframe to complete, and deliverable for every execution step • Question assumptions every step of planning process Key Components to Planning
Requires skillful collection of data • Timing • Sources • Scope • Requires skillful and creative analysis of data collected • Requires skillful presentation of the analysis Execution:Key Components to Having a Great Assessment Completed
Two parts to having great data for a Needs Assessment • Data Collection • Data Used • The two parts are a team that have to be aligned to achieve a great needs assessment Using Great Data
Data bases • Examples: U.S. Census and ACS; BSSF; RWJ Health Rankings; Kids Count • New to consider- social media, consumer internet use data • Surveys – do your own or use a county partner’s • Focus groups • Community Forums • Interviews Collecting Data: Sources
Have to think about, plan and assign responsibility for following tasks: • Time line and budget set and approved for assessment • Staff resources or consultant resources to be used in collecting data • Other stakeholders whose role needs to be defined and agreed to in collecting data • If using more than one source of data, how will it be integrated? • Logistics on collecting data- how, where, when Collecting Data: Part 2
Data analysis isn’t the same as compiling data • How use needs to be creative • How present data analysis needs to be considered • “The Report” • Infographics • Tweets • Fact sheets by topics • Press releases tied to an education or advocacy campaign Using Data (Data Analysis)
If ask the right questions in survey or focus groups, will have great data to analyze • Allows for seeing trends • Allows for seeing emerging issues • Great Assessments include comparison data in the analysis • Using the data well to tell the story also requires smart and creative charts, maps, graphs Components of Doing Data Analysis well
Can be: State to County County wide to target population (CAA clients or all Low-income clients within county) Target population measured to a self sufficiency benchmark Sub-populations of target population – to learn how differences in age, education, race etc. are impacting the intensity of barriers. Trend lines can be used to compare how one aspect has changed or hasn’t changed over time What is Comparison Data?
Example of using Word Clouds to present non-quantitative data
Example of Mapping Census Data at county sub-division level Percent of those in Poverty who moved within County in last year, shown by Township, 2011 • Countywide percent of those in poverty who moved within County in last year – 20.9%
Example of Mapping Data with Venn and Vector charts Hillsdale County Jobs by Residence, 2011
Don’t have to do it all at once –build to greatness Start with what is most important to you agency and Board Plan, plan, plan before implement Be creative Be curious Be flexible Final Thoughts
KMartinWorks@Yahoo.com Questions?