Download
1 / 23
230 likes | 430 Vues
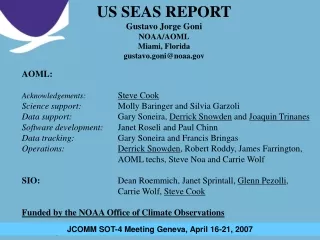
NOAA/AOML Thermosalinograph (TSG) Operations JCOMM SOT-4 Meeting Geneva, April 16-21, 2007 Gustavo Jorge Goni NOAA/AOML Miami, Florida gustavo.goni@noaa.gov. Acknowledgements: Steve Cook and Robert Molinari TSG-SEAS: Paul Chinn and Janet Roseli

E N D
NOAA/AOML Thermosalinograph (TSG) Operations JCOMM SOT-4 Meeting Geneva, April 16-21, 2007 Gustavo Jorge Goni NOAA/AOML Miami, Florida gustavo.goni@noaa.gov Acknowledgements: Steve Cook and Robert Molinari TSG-SEAS: Paul Chinn and Janet Roseli Operations: Derrick Snowden, James Farrington, and Carrie Wolff Data processing: Guilherme Castelao and Hiquin Yang Data distribution: Guilherme Castelao, Francis Bringas, and Joaquin Trinanes Web page development: Francis Bringas and Pedro DiNezio NOAA/NMFS Collab.: Jon Hare, Dan Smith, and Jack Jossie NOAA Marine Operations: Dennis Shields, Tom Stepka, and John Katebini Explorer of the Seas*: Rod Zika and Liz Williams Funded by the NOAA Office of Climate Observations * Funded by NOAA and NSF
NOAA/AOML TSG project description http://www.aoml.noaa.gov/phod/tsg/index.php
sea surface salinity (SSS) • Provides key information on the variability of global precipitation, evaporation, and the fresh water cycle. • Is a factor in water mass formation and SSS variability can affect the intensity of the thermohaline circulation. • Can be utilized to initialize climate forecast models, if salinity profiles are not available. • Through Alkalinity improves is linked to the amount of dissolved CO2in the oceans. • Will be used to validate and calibrate fields obtained from the SMOS and Aquarius satellite missions. • Can be used to assess numerical model performances
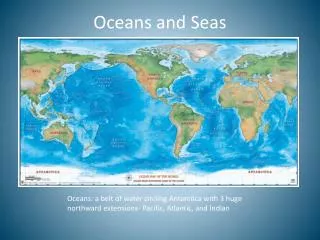
NOAA/AOML Thermosalingraphs 2 cargo ships Atlantic Ocean. 1 cruise ship western North Atlantic, Caribbean Sea and Gulf of Mexico. 1 cargo ship Pacific Ocean. 1 cruise ship around the world twice a year. 15 NOAA ships global. • SBE 21: • Oleander, • Skogafoss, • NOAA fleet. • SBE 45 (micro TSG): • RCCL Explorer of the Seas, • Albert Rickmers, • SAS Explorer, • NOAA fleet.
2001 2002 2003 Skogafoss Oleander C. Waikato 2004 2005 2006 AOML-TSG transects
Current NOAA/AOML-TSG transects currently maintained TSG transects • Upcoming TSG installations: • Semester At Sea M/V Explorer (around the world twice a year) • Albert Rickmers (Pacific Ocean)
GOSUD recommended QC steps RT DT AOML additional QC steps AOML TSG QC steps • platform identification • impossible date • impossible location • position on land test(ETOPO5*) • impossible speed(4-35 knots) • global ranges • regional ranges • spike test • gradient test • constant value check • climatology and NCEP weekly analysis • buddy check (comparison against ARGO, CTD, …) • water sample check 2-10-30 sec sampling 5 min QC data
TSG Water samples Profiling floats Climatology NOAA/AOML-TSG QC
TSG Water samples Profiling floats Climatology Identification of equipment bias in TSG using climatology and in-situ observations NOAA/AOML-TSG QC
Total data Bad flags TSG data 5 min DT QC performance
2001-2006 transects 2001-2006 SSS space-time diagram Skogafoss TSG transects
Gulf Stream front 2001-2006 transects 2001-2006 SSS space-time diagram Oleander TSG transects
Summary of TSG data QC statistical analysis (Skogafoss and Oleander) TSG temperatures are: 0.22-0.26C higher than the profiling float temperature, 0.16-0.29C higher than the XBT temperature and 0.09 C higher than the water sample. TSG Salinity values are in good agreement with concurrent observations: 0.05 lower than the float salinity and 0.07 lower than the water sample. Issue: need of external temperature sensor
Altimetry-derived Yucatan Straits geostrophic current transport RCCL’s Explorer of the Seas TSG transects 2006-2007 SSS time series 2006 transects
NOAA/AOML TSG data distribution into GTS Location of TSG data taken from GTS, March-April 2007
2007 TRACKOB GTS salinity data NOAA AOML: 21,000 reports to GTS Others: 18 reports to GTS
current Cargo ships: Oleander and Skogafoss Semester At Sea’s M/V Explorer Cargo ship Albert Rickmers 2007 TRACKOB GTS salinity data
NOAA Fleet Ships with pCO2 systems
NOAA/AOML TSG plans • Continue transmission of data of RCCL’s Explorer into the GTS. • Initiate transmission of QC’ed (RT) data of cargo ships into the GTS. • Initiate transmission of QC’ed (RT) data of NOAA fleet into the GTS. • Test external temperature sensor in one cargo ship. • Continue support of pCO2 systems. • Collaborate with future satellite salinity missions. • Initiate a sustained and strong collaboration with data centers, submission of QC’ed data to NODC and Coriolis. • Have a strong participation within GOSUD. • New TSG installations: • M/V Explorer of Semester At Sea • Albert Rickmers. • Initiate tests with BUFR and Metadata. • Science support. Semester At Sea’s M/V Explorer
NOAA/AOML TSG Operations Gustavo Jorge Goni NOAA/AOML Miami, Florida gustavo.goni@noaa.gov