Download
1 / 7
70 likes | 305 Vues
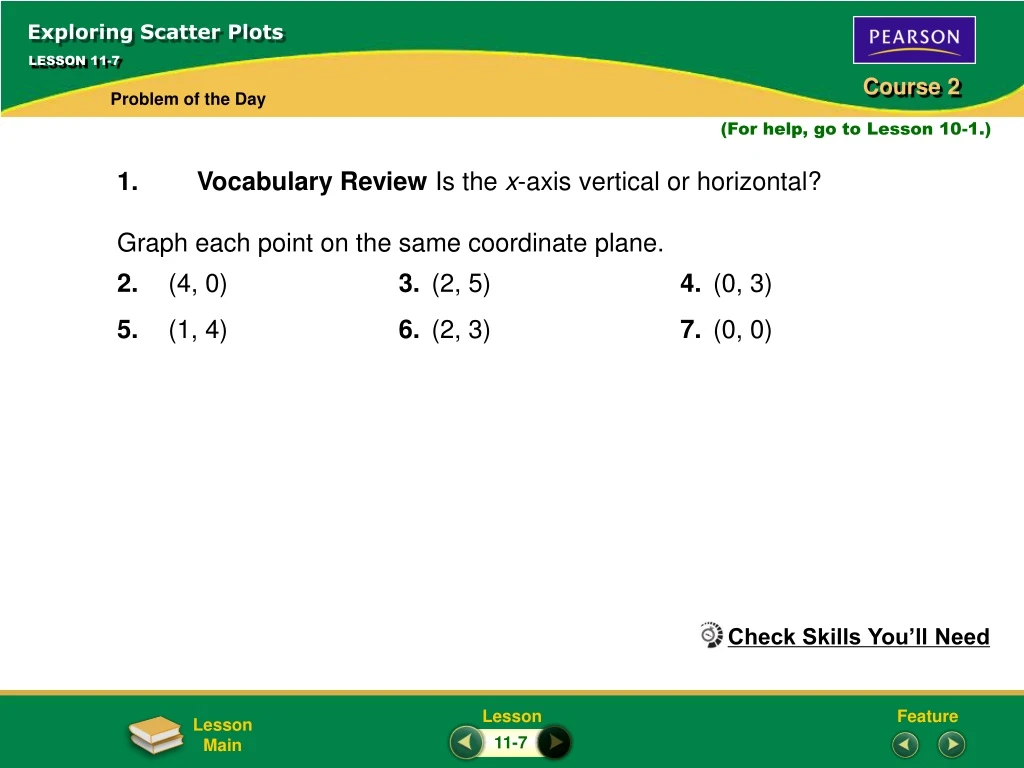
Exploring Scatter Plots. LESSON 11-7. Problem of the Day. (For help, go to Lesson 10-1.). Vocabulary Review Is the x -axis vertical or horizontal? Graph each point on the same coordinate plane. 2. (4, 0) 3. (2, 5) 4. (0, 3)

E N D
Exploring Scatter Plots LESSON 11-7 Problem of the Day (For help, go to Lesson 10-1.) • Vocabulary Review Is the x-axis vertical or horizontal? • Graph each point on the same coordinate plane. • 2. (4, 0) 3. (2, 5) 4. (0, 3) • 5. (1, 4) 6. (2, 3) 7. (0, 0) Check Skills You’ll Need 11-7
Exploring Scatter Plots LESSON 11-7 Check Skills You’ll Need Solutions 1. horizontal 2-7. 11-7
Scatter Plot – a graph that shows two sets of data • Graphed as ordered pairs (x, y) • Look for a pattern: • Positive trend? • Negative trend? • No trend?
Height (in.) Test Scores 58 90 60 95 63 90 64 70 65 100 65 90 66 60 67 90 68 80 68 75 70 85 70 100 71 80 72 70 This point is for a person with a height of 58 in. and test score of 90. Exploring Scatter Plots LESSON 11-7 Additional Examples Quick Check Graph in a scatter plot the data from the table. Each row in the table represents a point on the scatter plot. 11-7
Exploring Scatter Plots LESSON 11-7 Additional Examples Describe the trend in the scatter plot for Example 1. As the height increases, there is no upward or downward trend in the test scores. So the scatter plot does not show a trend. Quick Check 11-7
Time Temperature 7 A.M. 13º F 8 A.M. 18º F 9 A.M. 25º F 10 A.M. 32º F a positive trend Exploring Scatter Plots LESSON 11-7 Lesson Quiz 1. Make a scatter plot of the data in the table and describe the trend. 11-7
Homework: • Lesson 1-3, pp. 546-547: #s 6, 8-15 all, 17 • Lesson 11-7, pp. 569-570, #s 9-14 all, 16 • Collect high and low temperatures for weather project • Quiz (11-1 to 11-3) on Friday