Download
1 / 70
1.31k likes | 4.96k Vues
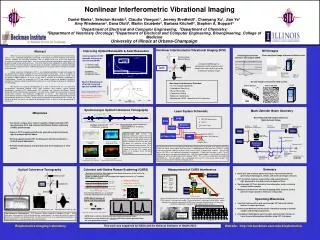
Ultrasonic Nonlinear Imaging- Tissue Harmonic Imaging. Conventional B-mode image (AP4CH). THI. Fundamental. THI. Fundamental. Tissue Nonlinear Imaging. Performance of ultrasound has been sub-optimal on technically difficult bodies.

E N D
Ultrasonic Nonlinear Imaging-Tissue Harmonic Imaging Tissue Harmonic Imaging
THI Fundamental
THI Fundamental
Tissue Nonlinear Imaging • Performance of ultrasound has been sub-optimal on technically difficult bodies. • Most recent new developments have bigger impact on technically satisfactory bodies. • Poor image quality leads to uncertainty in diagnosis and costly repeat examinations. Tissue Harmonic Imaging
Tissue Harmonic Imaging • Methods to improve image quality: • Different acoustic window. • Lower frequency. • Adaptive imaging. • Non-linear imaging (or harmonic imaging). Tissue Harmonic Imaging
Origin of Tissue Non-linearity • Finite amplitude distortion: peaks of the waveform travels faster than the troughs. Tissue Harmonic Imaging
Pressure Before distortion After distortion t Tissue Non-Linearity • Signal Source • Finite amplitude distortion generated tissue harmonics
Non-Linear Propagation Tissue Harmonic Imaging
80 Fundamental 2nd Harmonic 60 Velocity(cm/sec) 40 20 0 0 20 40 60 80 Depth(mm) Axial Amplitude Tissue Harmonic Imaging
THI Characteristics 4MHz Beam Patterns transducer transducer dB Lateral Position (mm) Tissue Non-Linearity
Tissue Non-linearity • Tissue harmonics are virtually zero at the probe face.The intensity continues to increase until attenuation dominates. • The higher the intensity is, the more tissue harmonics are generated. • Such a mechanism automatically increase the difference between signal and acoustic noise. Tissue Harmonic Imaging
Advantages of Tissue Harmonic Imaging • Low sidelobes. • Better spatial resolution compared to fundamental imaging at the original frequency. • Less affected by tissue inhomogeneities – better performance on technically difficult bodies. Tissue Harmonic Imaging
Non-linear Parameter B/A • B/A defines non-linearity of the medium. The larger the B/A, the higher the non-linear response. Tissue Harmonic Imaging
B/A Parameters: Measurements • Finite amplitude method: • B/A is related to the second harmonic generation. Thus, it can be found by relating the signal amplitude at the fundamental frequency to the second harmonic component. • Thermodynamic method: • The B/A value is determined by measuring the change of sound speed with pressure and temperature. Tissue Harmonic Imaging
B/A Parameters: Typical Values • Typical values: • Water:5.5+/-0.3. • Liver: 7.23. • Fat: 10.9. • Muscle: 7.5. • Results from both methods have excellent agreement. • B/A imaging may be used for tissue characterization. Tissue Harmonic Imaging
Image Analysis Issues • Low signal-to-noise ratio: coded excitation, simultaneous multiple transmit focusing. • Spectral leakage and image quality degradation. • Spatial covariance analysis for correlation-based processing. • Motion artifacts in pulse inversion imaging . Tissue Harmonic Imaging
MHz MHz LPF HPF Filter Based Image Formation • Fundamental and Harmonic Imaging Fundamental Imaging Spectrum Spectrum Harmonic Imaging Transmit Signal Received Signal
MHz MHz MHz MHz Effects of Harmonic Leakage • Motive : • Contrast resolution degradation 4MHz Beam Patterns dB Transmit Spectrum Received Spectrum Lateral Position (mm)
Transducer High Voltage Amplifier & T/R Switch Waveform Generator Sources of Harmonic Leakage • Designed transmit waveform. • System nonlinearity. • Electromechanical conversion. Tissue Harmonic Imaging
Designed Waveform (I) • Characteristics of transmit waveforms. Waveforms Normalized Amplitude s Spectra dB MHz Tissue Harmonic Imaging
Spectrum of Transmit Signal Leakage MHz Fundamental band Harmonic band Designed Waveform (II) • Signal bandwidth. Tissue Harmonic Imaging
Non-linear Propagation Wave at distance z angular spectrum method Linear propagation to z+Dz frequency domain solution to Burgers’ equation Nonlinear propagation at z+Dz Tissue Harmonic Imaging
Nonlinear Simulation Model • Model the Nonlinear Propagation • Δf: fundamental frequency • un: Sin(2π(nΔf)t) • β:nonlinear parameter • c:sound velocity
Results: Effect of Bandwidth • Gaussian at 25% and 50% • Contrast v.s. Spatial Harmonic Beam Patterns 0 BW=25% BW=50% -20 dB -40 -60 -10 -5 0 5 10 Lateral Position (mm)
Results: Signal Type • Sine, square and Gaussian wave, BW=25% • Smooth envelope has better contrast Harmonic Beam Patterns 0 Gaussian Gated sine Gated square -20 dB -40 -60 -10 -5 0 5 10 Lateral Position (mm)
Results: Signal Type • Gaussian, gated sine and gated square waves. • BW=50%. Harmonic Beam Patterns Integrated Harmonic Beam Patterns dB Gaussian Gated sine Gated square 4MHz linear Lateral Position (mm) Lateral Position (mm) Tissue Harmonic Imaging
30 2.5 (mm) 0 0 (ns) -2.5 -30 -5 0 10 -10 5 (mm) Effects of Harmonic Leakage • Tissue Inhomogeneities • Fat layer: 15mm thick, B/A=10. • Aberrating plane: max. time delay error=30ns, correlation length=5mm. Phase Aberration Pattern
Results: Tissue Inhomogeneities Integrated Harmonic Beam Patterns Harmonic Beam Patterns • BW=50%. dB Gaussian Gated sine Gated square 4MHz linear Lateral Position (mm) Lateral Position (mm) Tissue Harmonic Imaging
Effects of Harmonic Leakage • Drive Voltage • Magnitude => nonlinearity Spectra Beam Patterns Harmonic(1 Volt) Fundamental(1 Volt) Harmonic(5 Volt) Fundamental(5 Volt) 1 Volt 5 Volt dB dB Frequency(MHz) Lateral Position(mm)
Harmonic Beam Patterns BW=25% BW=50% dB Lateral Position(mm) Results: Bandwidth Spectra • Gaussian envelope, 1 Volt, 25% vs. 50%. BW=25% BW=50% dB Frequency(MHz) Tissue Harmonic Imaging
Results: Drive Voltage Beam Patterns Spectra • 1Volt vs. 5Volt. Harmonic(1 Volt) Fundamental(1 Volt) Harmonic(5 Volt) Fundamental(5 Volt) 1 Volt 5 Volt dB dB Lateral Position(mm) Frequency(MHz) Tissue Harmonic Imaging
Pulse Inversion Fundamental signal Positive driving pulse t f Harmonicsignal Nonlinear propagation t f Negative driving pulse t f Tissue Harmonic Imaging ONLY harmonic signal
Pulse Inversion • Pulse inversion reduces sidelobe levels Fundamental Beam Harmonic Beam (Filtering) Harmonic Beam (Filtering) Harmonic Beam (Pulse inversion) Gaussian pulse Tissue Harmonic Imaging Sine pulse Sine pulse Gaussian pulse
Pulse Inversion • harmonic leakage could be avoided • all linearly propagated components are cancelled Harmonic Beam Patterns at 50% Bandwidth dB Tissue Harmonic Imaging Lateral Position(mm)
Harmonic Leakage • Smooth envelopes provide lower sidelobes, but also require a more sophisticated transmitter. • Large bandwidths improve axial resolution, but also increase sidelobes. • Sidelobe differences decrease in the presence of tissue inhomogeneities. • Spectral leakage must be suppressed without affecting fundamental beams. • Pulse inversion technique is the most effective. Tissue Harmonic Imaging
v1 v2 Array Transducer Sound Velocity Inhomogeneities Tissue Harmonic Imaging
Spatial Covariance Analysis • Sound velocity inhomogeneities are conventionally corrected by correlation-based methods. • The covariance of signals received at different positions is critical to correlation-based correction techniques (the van Cittert-Zernike theorem). • Is it possible to further improve the image by combining tissue harmonic imaging and phase aberration correction? • Optimal frequency selection for imaging and time delay estimation. Tissue Harmonic Imaging
Progress: Simulations • Transmit • beam formation by FDSBE • Receive • time-domain signal for each channel Tissue Harmonic Imaging a,b: length and width of channel
channel time Progress: Simulations Correlation coefficient channel Tissue Harmonic Imaging
Spatial Covariance: Experiments Spatial Covariance: Simulations 1 1 3.5MHz Fundamental 2MHz Fundamental 7MHz Second Harmonic 4MHz Second Harmonic 0.8 0.8 0.6 0.6 Correlation Coefficient 0.4 0.4 0.2 0.2 0 0.5 1 0 0.5 1 Progress: Results • Harmonic covariance is generally similar to or lower than fundamental covariance Tissue Harmonic Imaging Normalized Distance
Spatial Covariance: Simulations Spatial Covariance : Experiments 1 1 2MHz Fundamental 3.5MHz Fundamental 4MHz Second Harmonic 7MHz Harmonic 0.8 0.8 0.6 0.6 Correlation Coefficient 0.4 0.4 0.2 0.2 0 0.5 1 0 0.5 1 Normalized Distance Progress: Results • With sound velocity inhomogeneities Tissue Harmonic Imaging
Fundamental Spatial Covariance: Experiments Second Harmonic Spatial Covariance: Experiments 1 1 High SNR High SNR Low SNR Low SNR 0.8 0.8 0.6 0.6 Correlation Coefficient 0.4 0.4 0.2 0.2 0 0.5 1 0 0.5 1 Normalized Distance Progress: Results • Effects of SNR Tissue Harmonic Imaging
Spatial Covariance • When adequate SNR is available • Whether the sound velocity variations are present or not, the harmonic covariance is generally similar to or lower than fundamental covariance. • When SNR is low • Harmonic covariance is significantly affected. • Imaging at the second harmonic frequency, correlation-based correction at the fundamental frequency. Tissue Harmonic Imaging
Harmonic Interference • In contrast imaging, in which the tissue harmonic signals are un-desirable, the amplitude of the propagating wave needs to minimized. • Large apertures (smaller f-numbers) may be used. • It was reported that tissue harmonic signal can be reduced by 3dB by doubling the aperture size. Tissue Harmonic Imaging
Harmonic Interference • Harmonic cancellation system: non-linear propagation is reduced by using a new signal at the harmonic frequency. • Phase and magnitude of the signal may be pre-calculated, but on-line adjustment is necessary. • Due to attenuation, optimal effects may only be achieved locally. Tissue Harmonic Imaging
Ultrasonic Nonlinear Imaging- Contrast Harmonic Imaging Tissue Harmonic Imaging
Contrast Harmonic Imaging • Contrast agents are used to provide higher contrast. The three commonly seen contrast agents are backscatter, attenuation and sound velocity. • Contrast agents could be solid particles, emulsion, gas bubbles, encapsulated gas, or liquid. Tissue Harmonic Imaging
Contrast Harmonic Imaging • Primary clinical benefits: • Enhanced contrast resolution between normal and diseased tissues. • Outline of vessels or heart chambers. • Tissue characterization by using tissue specific agents. • Increasing blood flow signals. • Dynamic study using washout curve. Tissue Harmonic Imaging