Download
1 / 27
280 likes | 313 Vues
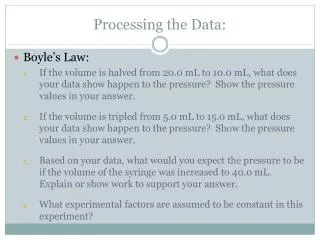
Health Management Information Systems. Data Processing. Topic 4. João Carlos de Timóteo Mavimbe Oslo, April 2007. Presenting Interpreting. Data Collation & Accuracy. ANALYSIS Processing. USE. Collection. Input Raw data. Learning objectives (1).

E N D
Health Management Information Systems Data Processing Topic 4 João Carlos de Timóteo Mavimbe Oslo, April 2007
Presenting Interpreting Data Collation & Accuracy ANALYSIS Processing USE Collection Input Raw data
Learning objectives (1) • Explain the use of the data handling process as a strategy to provide good data quality • Explain the techniques for providing and ensuring good quality data • Describe mechanisms for assessing data quality
Learning objectives (2) • Examine the importance of good data quality • Appreciate the importance of accuracy in health data • Understand why errors occur • Acquire the skills required to detect, correct and prevent future errors • Establish and apply the logistics of error checking
Presenting Interpreting Data Collation & Accuracy ANALYSIS Processing USE Collection Input Raw data Processing data in the information cycle
Ensuring data accuracy • Once data has been collected, it should be checked for any inaccuracies and obvious errors. • Ideally this should be done as close to the point of data collection as possible. • But also at all steps of the information cycle.
Why checking data is vital? • Use of inaccurate data is DANGEROUS • Producing data is EXPENSIVE • Inaccurate data are USELESS data • Producing inaccurate data is a WASTE of money and time
Why checking data is vital? Better to have NO data, than to have inaccurate data!!!
Common problems with data • large gaps • unusual month to month variations • duplication • Promoted by different vertical programs • inconsistencies • unlikely values • data is present where it should not be • typing errors • maths problems – poor calculation • data entered in wrong boxes
Good quality data • WHAT? data that are complete, correct and consistent (and timely) • WHY? facilitates: good decision-making appropriate planning ongoing Monitoring & Evaluation improvement of coverage and quality of care • HOW? provides an accurate picture of health programmes and services
Visual scanning (eyeballing) checking for 3 C’s • Completeness • Correctness • Consistency
Are data complete? • submission by all (most) reporting facilities • physical events observed = events registered (how?) • registered data = collated data (how?) • all data elements registered
Are data correct? • data within normal ranges • logical data • existing standardised definitions used adequately • legible handwriting • are there any preferential end digits used?
Are data consistent? • data in the similar range as this time last year (last reporting period) • no large gaps • is the correct target population being used?
Accuracy enhancing principles • Training • User-friendly collection/collation tools • Feedback on data errors • Feedback of analysed Information • Use of information (and prove it!)
How do you detect Errors? • general accuracy checking measures • specific accuracy checking measures
General accuracy checks • Completeness • Proper place • Friendly tools • Arithmetic
Specific Accuracy Checks • Time-trend consistency • Time-trend variation • Minimum/maximum • Realism • Comparison • Parts vs whole • Preferential end-digits
PREFERENTIAL END-DIGITS Other examples ?
Practical error checking procedures • Check completeness of the data forms • Set minimum and maximum values • Examine a printout of data for errors using general and specific error checks • Hold an error feedback session
What to do if you find errors? • Find the cause • Correct the error • Prevent future errors
small, essential dataset - EDS • clear definitions - standardized • careful collection and collation of data – good tools • local analysis of data using relevant indicators • presentation of information to all collectors • regular feedback on both data and information • supportive supervision - at all levels • ongoing training and support • discussion of information at facility team meetings • monitoring use of information
Data, in order to be locally useful, should be: • AVAILABLE ON TIME fix dates for reporting • AVAILABLE AT ALL LEVELS who reports to whom? - feedback mechanisms • RELIABLE & ACCURATE check that all data is correct, complete, consistent • COMPREHENSIVE collected from all possible data sources • USABLE if no action, throw data away • COMPARABLE same numerator and denominator definitions used by all
Controlling quality with DHIS • Maximum / minimum values • 13-month retrospective • Regression line • Validation rules: absolute statistical • Validation reminders