Download
1 / 14
140 likes | 313 Vues
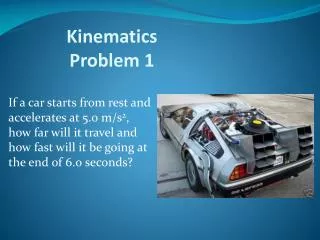
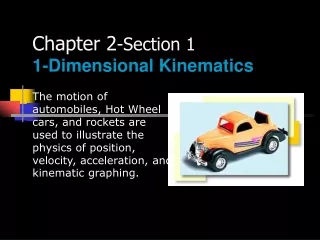
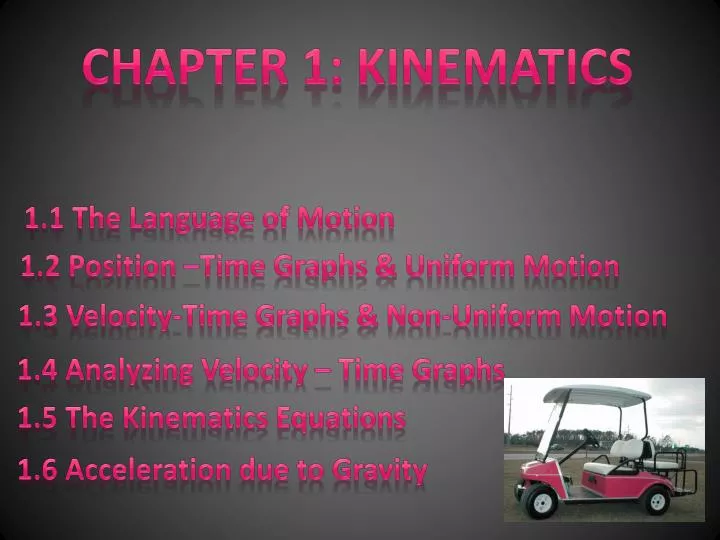
Chapter 1: Kinematics. 1.1 The Language of Motion. 1.2 Position –Time Graphs & Uniform Motion. 1.3 Velocity-Time Graphs & Non-Uniform Motion. 1.4 Analyzing Velocity – Time Graphs. 1.5 The Kinematics Equations. 1.6 Acceleration due to Gravity. 1.4 Graphical Analysis.

E N D
Chapter 1: Kinematics 1.1 The Language of Motion 1.2 Position –Time Graphs & Uniform Motion 1.3 Velocity-Time Graphs & Non-Uniform Motion 1.4 Analyzing Velocity – Time Graphs 1.5 The Kinematics Equations 1.6 Acceleration due to Gravity
1.4 Graphical Analysis • Putting it all together • Combining d-t and v-t graphs • Problem solving with d-t and v-t graphs
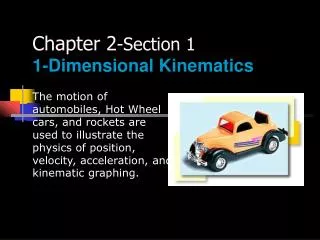
1.4 Graphical Analysis • A common mistake by Physics 20 students is when they assume that different types of graphs work the exact same way. • The graphs can be related to each other, but that doesn’t mean you look at them the same way. v vs t d vs t 1) An object moves at a constant velocity. 2) An object stops moving.
1.4 Graphical Analysis d vs t v vs t 3) An object speeds up at a constant rate. d vs t v vs t 4) An object slows down at a constant rate.
1.4 Graphical Analysis • Acceleration • Rate of change in velocity or speed • Found using SLOPE of a v-t graph • Units m/s2 • Displacement • Can be found as the area under the graph • May need to be split up (triangle / square / rectangle)
1.4 Graphical Analysis Bart starts from Airdrie and drives north at 80 km/h. Lisa starts 30 minutes after Bart and drives at 120 km/h north. At what time and position will Lisa pass Bart? You can solve by • Creating a data table • Constructing a graph • Constructing a system of equations
1.4 Graphical Analysis Given the velocity vs. time graph below • What is the average acceleration? • What is the change in displacement? (+ or -) 24.0 Velocity (m/s) 0.0 9.0 Time (s)
1.4 Graphical Analysis • Find the acceleration at 6.0 s • What is the total displacement after 10.0 s 12.0 Velocity (m/s) 4.0 0.0 6.0 10.0 Time (s)
1.4 Graphical Analysis • What is the total displacement? • Sketch a corresponding d-t graph. • What is the average velocity from 0 – 18 s? 8.0 Velocity (m/s) 0 -4.0 0.0 10 18 Time (s)
1.4 Graphical Analysis • Draw the corresponding v – t graph for the d – t graph given.
1.4 Graphical Analysis • Need to know SPEED if we need to draw a speed-time graph • Speed from d-t graph = SLOPE • Using (0,0) and (25,75) as our two points. • Rise = 75 m – 0 m • Run 25 s - 0 s • = 3 m/s
1.4 Graphical Analysis • Diagonal line on a d-t graph means CONSTANT MOTION so the object is STAYING at 3 m/s • Draw the corresponding v-t graph