Download

1 / 81
840 likes | 1.06k Vues
2011.09.22. Capstone Design 2. (Presenter) 20072408 Jo Ji-Yeon 20062410 Park Deuk -Young 20072406 Kim Bo- Kyoung 20062405 Park Chan Hyeok. Contents. Company Introduction. Project Outline. Project Plan. Final Goal. Q&A. 1. Company Introduction. Company : Hyun- dai Corporation

E N D
2011.09.22 Capstone Design 2 (Presenter) 20072408 Jo Ji-Yeon 20062410 Park Deuk-Young 20072406 Kim Bo-Kyoung 20062405 Park Chan Hyeok
Contents Company Introduction Project Outline Project Plan Final Goal Q&A
1. Company Introduction • Company : Hyun-dai Corporation • Address: 1st Avenue Industrial Complex, Pyeongdong, GwangsanguGwangjuMetrocity. • TEL : 062) 944-9011 • FAX : 062) 944-9012 • Main Business : Iron Fracture,micro-material - Cutting CNC Computer model - Manufacturing CNC HOLE - Cutting Stainless steel(SUS)sale
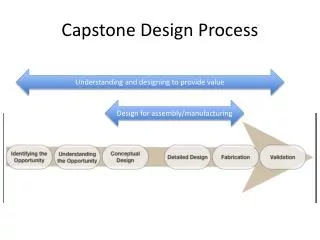
2. Project Outline Current Factory System Customer Customer Volume of orders Material Complete product Production • Current factory system is that workers get order from customer, they deliver the product to customer after complete the product manually.
2. Project Outline Alternative Alternative 2 : Is more efficient squeezing manpower as introducing new facility that do manufacturing press task? Alternative 1 : Is more efficient for producing added manpower for manufacturing press task? • Analyze these alternatives through technique trend, • marketability & cost analysis, Engineering economic principle, • management science etc. many technique.
4. Final Goal • The goal is that Hyun-dai Corporation expects efficient investment decision-making for improving quality of production, reducing cost, increasing produce efficiency through many alternatives.
5. Q&A Q & A
2011.10.06 The company’s decision making of manufacturing press about equipment management (Presenter) 20072406 Kim Bo-Kyoung 20062410 Park Deuk-Young 20061111 Park Chan Hyuck 20072408 Jo Ji-Yeon
Contents Company Introduction Process Flow Diagram NEXT Q&A
1. Company Introduction • Company : Hyun-dai Corporation • Main Business : Iron Fracture,micro-material - Cutting CNC Computer model - Manufacturing CNC HOLE - Cutting Stainless steel(SUS)sale • The total sales: 4,199,657,552 won • Business hours : • Weekday8:00am~5:30pm • Weekend 8:00am~4:30pm • Personnel organization: 20 + α (part time)
2. Process Flow Diagram Detailed Procedure Transfer floor plan Order Mail, Visit site, Fax CAD Floor Plan(2D) Transfer to engineer’s representative Primary process Secondary process Packing Shipping Cutting Hole Process & Bending & Chamfering
3. NEXT • Financial Statement Analysis • Investigate machine cost • Select several alternatives
4. Q&A Q & A
2011.10.27 The company’s decision making of manufacturing press about equipment management (Presenter) 20062405 Park Chan Hyeok 20062410 Park Deuk-Young 20072406 Kim Bo-Kyoung 20072408 Jo Ji-Yeon
Contents Financial Statement Ratio Analysis? Classification andMeaning of Financial Statement Analysis Liquidity Ratio Stability Ratio Q&A
1. Financial Statement Analysis • Financial Statement Ratio Analysis - It is the process of understanding the risk and profitability of a firm (business, sub-business or project) through analysis of reported financial information, particularly annual and quarterly reports. • Purpose of Financial Statement Analysis • It is the selection, evaluation, and interpretation of financial data, along with other pertinent information, to assist in investment and financial decision-making. • May be used internally to evaluate issues such as employee performance, the efficiency of operations, and credit policies, and externally to evaluate potential investments and the credit-worthiness of borrowers, among other things
2. Classification andMeaning of Financial Statement Analysis
3. Liquidity Ratio • 1. liquidity ratio • Company's ability to repay short-term debt rating • Short-term investments and Verification of the conformity between short-term financing 1-1. Current Ratio • It is a financial ratio that measures whether or not a firm has enough resources to pay its debts over the next 12 months. • It compares a firm's current assets to its current liabilities →More than 150% * Current Ratio = current asset / current liabilities ㈜현대기업의 Current Ratio= (2,645,278/85,419) X 100 = 3096.83%
3. Liquidity Ratio 1-2. Quick Ratio • In finance, the quick ratio measures the ability of a company to use its near cash or quick assets to extinguish or retire its current liabilities immediately. • Quick assets include those current assets that presumably can be quickly converted to cash at close to their book values. → More than 100% * Quick Ratio = quick assets /current liability 현대기업의 Quick Ratio = (1,676,129/85,419) X 100 = 1962.24%
4. Stability Ratio • 2. stability ratio • It evaluate long-term default risk by using debt and capital • The Company's ability to remain in business in the long run, without having to sustain significant losses in the conduct of its business. 2-1. Debt to Equity Ratio - The relative size of the debt to capital - Company‘s Financial Risk - It is a financial ratio indicating the relative proportion of shareholders' equity and debt used to finance a company's assets. → Less than 100% * Debt to Equity Ratio= liabilities/ owner's capital 현대기업의 Debt to Equity Ratio= ((85,419+2,382,497)/1,869,594) X 100 = 132%
4. Stability Ratio 2-2. Capital adequacy ratio • It show us equity out of Company's total assets • Capital adequacy ratios ("CAR") are a measure of the amount of a bank's core capital expressed as a percentage of its assets weighted credit exposures. → More than 40% (Less than 15% : insolvent enterprise) Capital adequacy ratio= owner's capital/asset 현대기업의 Capital adequacy ratio= (1,869,574/4,337,511) X 100 = 43.1% 2-3. Times-interest-earned ratio - It is a measure of a company's ability to honor its debt payments. - Evaluate the ability to pay interest expense through Operating profit. → More than 200% * Times-interest-earned ratio= business profits / interest cost 현대기업의 Times-interest-earned ratio = (355,960 / 152,287) X 100 = 233.7%
4. Stability Ratio 2-4. fixed assets to net worth and fixed liabilities andfixed ratio • Measure the degree of immobilization of the capital • Fixed-asset turnover is the ratio of sales (on the profit and loss account) to the value of fixed assets (on the balance sheet). • It indicates how well the business is using its fixed assets to generate sales. →Less than 100% * fixed assets to net worth and fixed liabilities= noncurrent asset / (equity capital+ fixed liabilities ) 현대기업의 fixed assets to net worth and fixed liabilities = (1,691,975/(1,869,594+2,382,497)) X 100 = 39.8% * fixed ratio= noncurrent asset / equity capital 현대기업의 fixed ratio = (1,691,975/1,869,594) X 100 = 90.4%
4. Stability Ratio 2-5. Total Borrowings and bonds payable to total assets • Measured against debt to total capital * Total Borrowings and bonds payable to total assets = (long-term debt + short-term debt) / return on assets 현대기업의 Total Borrowings and bonds payable to total assets = (2,363,479/4,337,511) X 100 = 54.5% → Less than 100% → profitability↑, stability ↑
5. Next • Activity ratio • Profitability ratio • Growth ratio
2011.11.03 The company’s decision making of manufacturing press about equipment management (Presenter) 20062410 Park Deuk-Young 20062405 Park Chan Hyeok 20072406 Kim Bo-Kyoung 20072408 Jo Ji-Yeon
Contents Activity ratio Profitability ratio Growth ratio Financial ratio assessment result Q&A
3. Activity ratio 3. Activity ratio - Activity ratios measure the effectiveness of the firms use of resources. 3-1. Receivable turnover ratio andReceivables collection period - Measure the effectiveness of receivables collection. (Unit : a thousand won) * Receivable turnover ratio = Sales account / Receivable = (4,199,657 / (855,660 + 430,134)) = 3.2662 * Receivables collection period = 365day / Receivable turnover ratio = 365 / 3.2662 = 111day → ㈜ Hyundai corp. buy and sell product on credit, and sales credit is collected after 111days.
3. Activity ratio 3-2. Inventory turnover ratio andInventory Average Retention Period • In accounting, the Inventory turnover is a measure of the number of times inventory is sold or used in a time period such as a year. The equation for inventory turnover equals the cost of goods sold divided by the average inventory. (Unit : a thousand won) *Inventory turnover ratio = Cost of sales /Inventory average balance = (3,639,820 / 969,149) = 3.7559 collects *Inventory Average Retention Period= 365 day / Inventory turnover ratio = 365 / 3.7559 = 97day → It looks that capital dropped on inventoriesis collected in about 97 days.
4. Profitability ratio 4. Profitability ratio - Measure the company's use of its assets and control of its expenses to generate an acceptable rate of return 4-1. Profit margin ratio • Profit margin is an indicator of a company's pricing strategies and how well it controls costs. Differences in competitive strategy and product mix cause the profit margin to vary among different companies. (Unit : a thousand won) * Profit Margin Ratio = Net Income / Revenue = (172,533/4,199,657) X 100 = 4.11% → ㈜ Hyundai corp. sales Net Income growed averagely by 4.11% comparing with the previous year.
4. Profitability ratio 4-2. Return on Owner’s Equity (= Return on equity) • Return on equity (ROE) measures the rate of return on the ownership interest of the common stock owners. It measures a firm's efficiency at generating profits from every unit of shareholders' equity (also known as net assets or assets minus liabilities). • ROE shows how well a company uses investment funds to generate earnings growth. (Unit : a thousand won) * Return on Owner’s Equity = Net Income / Owner's capital = (172,533/1,869,594 ) X 100 = 9.23% → Profit rate of Hyundai corp. increased by 9.23% comparing with the previous year.
4. Profitability ratio 4-3. Return on total asset - The return on assets percentage shows how profitable a company's assets are in generating revenue. (Unit : a thousand won) * Return on total asset = Net Income /Total asset = (172,533/4,337,511) X 100 = 3.98% → Total asset of Hyundai corp. showed regular growth by 3.98% comparing the previous year.
5. Growth ratio • 5. Growth ratio - Coefficient of fluctuation by year of financial statement like sales or total assets 5-1. Growth Rate of Sales (Unit : a thousand won) * Growth Rate of Sales = (the sales for this term– the sales for former period)/ the sales for former period = ((4,119,658-3,561,769)/3,561,769) X 100 = 17.9% → Hyundai corp. shows high growth at 17.9% comparing the sales for former period..
5. Growth ratio 5-2. Growth rate of total assets (Unit : a thousand won) * Growth rate of total assets = (the asset for this term– the asset for former period)/ the asset for former period = ((4,337,511-4,136,053)/4,136,053) X 100 = 4.87% → Hyundai corp. shows regular growth at 4.87% comparing the asset for former period.
5. Growth ratio 5-3. Growth rate of Net income (Unit : a thousand won) * Growth rate of Net income = (net profits during the term– the profits for former period)/ the profits for former period = ((172,533-142,270)/142,270)X 100 = 21.27% → Hyundai corp. shows high growth at 21.27% comparing the profits for former period.
Financial Statement • 엑셀 파일/ 스캔(재무제표)
Result Hyundai corp. would be useful when purchasing equipment making a decision of intention to invest based on valuation basis of financial statements ratio of past and current managerial condition.