Download
1 / 52
660 likes | 1.46k Vues
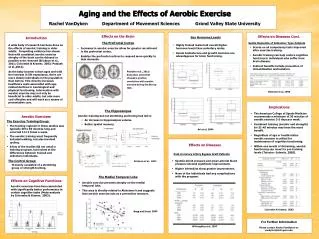
Aging and the effects of exercise on muscle mass and function. Stephen P. Sayers, PhD, Department of Physical Therapy, University of Missouri. Outline. I. Changes in Muscle Mass with Aging. Sarcopenia. II. Changes in Muscle Performance with Aging. Strength, Power.

E N D
Aging and the effects of exercise on muscle mass and function Stephen P. Sayers, PhD, Department of Physical Therapy, University of Missouri
Outline I. Changes in Muscle Mass with Aging Sarcopenia II. Changes in Muscle Performance with Aging Strength, Power III. Factors Responsible for Age-Related Changes in Muscle Mass and Function IV. Does Exercise Restore Muscle Mass and Function?
Changes in Muscle Mass with Aging 40% loss in muscle mass from 20-70 years of age Rogers & Evans, 1993 6% decline in muscle mass per decade from age 30-70 Fleg & Lakatta, 1988 1.4 –2.5% decline in muscle mass per year after age 60 Frontera et al., 2000
Changes in Muscle Mass with Aging Lexell et al., 1988
Sarcopenia age-associated decline in muscle mass • “Sarco” flesh (muscle). • “penia” deficiency. • Sarcopenia is associated with increased mortality and functional decline Roubenoff, 2003
21 year old Female (BMI = 24.3 kg/m2) 73 year old Female (BMI = 24.5 kg/m2) Sarcopenia age-associated decline in muscle mass
Sarcopenia • Muscle Fiber Changes with Aging: • Decreased muscle fiber size (atrophy) • 2) Decreased number of muscle fibers
Sarcopenia Muscle Fiber Changes with Aging: 1) Atrophy Men: 20-29 and 60-65 Type I - no change Type II - 25% decrease Men: 19-84 Type I - 6% decrease Type II - 35% decrease Larsson et al., 1978 Lexell, 1991
Sarcopenia • Muscle Fiber Changes with Aging: • Atrophy • By age 85, Type II fiber CSA may be less than 50% of that for Type I fibers Type I Type II
Sarcopenia • Muscle Fiber Changes with Aging: • Atrophy • Maintenance of Type I fiber size may be compensatory hypertrophy • Lexell, 1991 • Disuse of Type II fibers?
Sarcopenia Muscle Fiber Changes with Aging: 2) Decreased number of fibers 25% loss in men ages 19-37 to 70-73 (110,000 difference) Muscle of 20 yr old - 70% fibers Muscle of 80 yr old - 50% fibers Lexell et al., 1983 Lexell et al., 1988
Sarcopenia Muscle Fiber Changes with Aging: 2) Decreased number of fibers Selective loss of Type II fibers: Type I fiber % increased from 40 to 55 in men ages 20-30 and 60-65 Larsson, 1982 • Loss of Type II fibers? • Acquiring more Type I fibers?
Sarcopenia “No single feature of age-related decline can more dramatically affect nutritional status, ambulation, mobility, and functional independence.”* *Rosenberg 1989
Age group (years) Males (n=205) Females (n=173) <70 13.5 23.1 70 – 74 19.8 33.3 75 – 80 26.7 35.9 >80 52.6 43.2 Prevalence (%) of Sarcopenia* *New Mexico Elder Health Survey, Baumgartner et al. 1998
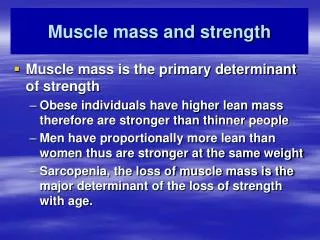
Muscle Strength • Maximum capacity to generate force or tension. • Muscle CSA • Intrinsic factors • MU recruitment / Firing rate
Upper extremity strength % of 20 yr old group Metter et al., 1997 J. Gerontol. Age
Strength Loss with Aging 8% loss per decade after age 45 - Brooks, 1995 Strength increases up to age 30 Plateaus from age 30 – 50 Declines 24-36% between 50-70Larsson, 1979 # women unable to life 4.5 kg (10 lbs) increased from 40% in 55-64 yr olds to 65% in those age 75-84.Jette & Branch, 1981
Strength Loss with Aging Most precipitous loss after age 70: 35% loss over 11 year period in 80 year old subjects Grabiner & Enoka 1995 15% loss per decade up to 6th and 7th decades of life, 30% loss per decade thereafterEvans, 1997
Strength loss does not always parallel loss in muscle mass • Specific Strength (Force per CSA) may be lower in older compared to younger men • Quadriceps CSA decreased 21% (65-80) • Force production decreased 39% Jubrias et al. (1997) • Quantitative and qualitative changes
Muscle Power • Power: Maximum rate of work performance Power = Force x Velocity
Power vs. strength over time % of 20 yr old group Metter et al., 1997 J. Gerontol. Age
Muscle Power • Men and women in their 70s compared to 20s: Vertical JumpForce 50% lower Vertical Jump Power 70-75% lower Bosco & Komi, 1980 • Strength loss 1-2% per year after 60 • Power loss is ~3.5% per year Skelton et al., 1994
How do changes in strength and power impact function? % MVC/Power needed to perform ADLs *Diminished reserve capacity
III. Factors Responsible for Age-Related Changes in Muscle Mass and Function
Sarcopenia* age-associated decline in muscle mass • etiology related to changes in: hormone status neural factors Inflammation protein/energy intake disuse atrophy Age-related Behavioral *Rosenberg 1989
Sarcopenia Roubenoff, 2003
What factors are responsible for decreased strength in older men and women? • Changes in force producing capability of muscle tissue • Changes in neural activation of muscles
1.Changes in force producing capabilities of muscle 1.Decrease In Specific Tension of Individual Fibers 2. Relative Increase in Type I Fiber Characteristics Death of –motor neurons (spinal cord) -Multiple MHC isoforms (hormones) Death of Some Muscle Fibers -Re-innervation of Some fibers -Motor Unit Remodeling (Fewer, larger MUs) 3. Muscle Atrophy Barry & Carson, J Gerontol 2004
2. Changes in neural activation of muscles “The ability to develop maximal force… is dependent upon the capacity of the nervous system to maximally activate individual muscles, and to coordinate appropriately the activation of groups of muscles.” Barry & Carson, J Gerontol 2004
2. Changes in neural activation of muscles 1.Inability to maximally activate individual muscles 2. Inability to coordinate groups of muscles •Increased co-activation of agonist/antagonist •Increased antagonist activation •Reduced cortical drive •Altered –motor neuron excitability Reduces net maximal joint torque Limits rate of force development •NMJ Degradation •Impaired E-C Coupling •Distrupted agonist/synergist activation Barry & Carson, J Gerontol 2004
Factors responsible for decreases in power Skeletal muscle mass “Sarcopenia” Neural Factors Fiber number, Cross-sectional area, Selective type II atrophy Larsson, 1979 Loss of Motor units (47% decrease 20-65) Doherty, 1993 MU remodeling (Type I) Specific tension, in vitro shortening velocity Larsson, 1997 Reduced MU firing rates, Asynchronous MU firing, Slowed nerve CV Contraction velocity: E-C coupling impairment SR impairment Actin slowing (18-25%)
Resistance Training in Older Adults • Landmark RT Studies: Moritani & DeVries (1980) Aniansson et al. (1980) First studies to demonstrate safety and potential for increases in strength in older men Little hypertrophy response
Resistance Training in Older Adults • Landmark Studies: • Resistance training and strength: • Men 60-72 (12 weeks): 107-226% increase • Frontera et al., 1988 • Women 64-86 (12 weeks): 28-115% increase • Charette et al., 1991 • Men & Women 86-96 (8 weeks): 174% increase • Fiatarone et al., 1990
Resistance Training in Older Adults • Landmark Studies Resistance training and hypertrophy: Men 60-72 (12 weeks): Type I – 33.5% increase Type II – 27.6% increase Frontera et al., 1988 Women 64-86 (12 weeks): Type I – 7.3% increase (NS) Type II – 20% increase Charette et a., 1991 Men & Women 86-96 (8 weeks): Muscle CSA (8.4-11%) Fiatarone et al., 1990
Power Training in Older Adults Fielding et al. (2002) Power training in older women (N=25; Age = 73.2 years) Power Training: High-intensity high velocity RT Strength Training: High-intensity low velocity RT LP and KE: 3 x 8, 3x/wk, 16-wks @ 70% 1RM
The Disablement Pathway (Nagi, 1965; Verbrugge & Jette, 1994) Pathology Impairment ? Strength Power Functional Limitation ? Disability
Resistance Training in Older Adults • Effects on Function and Disability are Questionable: Latham et al., 2003 Small to moderate effect on Function Little to no effect on Physical Disability
Functional Threshold Threshold Healthy Elderly Motor Impaired “Pre-Frail” Functionally Limited (Frail) Function Strength/Power
The Disablement Pathway (Nagi, 1965; Verbrugge & Jette, 1994) Pathology Impairment Functional Limitation Correcting “strength” impairments has been primary focus Disability What about other impairments?
Muscle Power • Maximum rate of work performance Power = F x V Key component of success in athletics
Is Muscle Power and Contraction Velocity Important in Older Adults?
Muscle Power and Function Studies have shown that lower extremity muscle power is a stronger predictor of functional limitations and disability than muscle strength in older men and women Bean et al.,2002; Suzuki et al., 2001; Foldvari et al., 2000 Muscle power declines sooner and more rapidly than strength
The Disablement Pathway (Nagi, 1965; Verbrugge & Jette, 1994) Pathology Impairment Functional Limitation *Power may be a more critical variable on which to focus resistance training protocols Disability
Low and High Velocity Power and Function Muscle power at high or low velocity may be more important to certain functional tasks than muscle strength Speed at which we generate power is critical to lower intensity functional tasks Cuoco A, Callahan DM, Sayers SP, et al. J. Am. Geriatr. Soc. 2004
Contraction Velocity and Function Contraction velocity alone was more important to walking speed than muscle strength in older adults Sayers SP, et al. J. Am. Geriatr. Soc. 2005
The Disablement Pathway (Nagi, 1965; Verbrugge & Jette, 1994) Pathology Impairment Functional Limitation *Contraction velocity (speed) may also be a critical variable on which to focus resistance training protocols Disability