Download
1 / 1
10 likes | 227 Vues
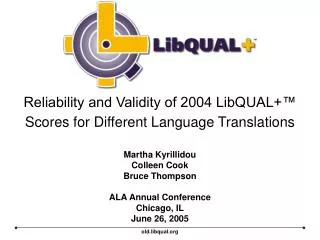
Ron Ward & Alan Gale University of Guelph Library, Guelph, Ontario, CANADA. Changing Lives Improving Life. The Issues… How can we fully utilize and best understand the LibQUAL+ results? What do the “mean” values represent? Are they truly representative of the frequency distribution ?

E N D
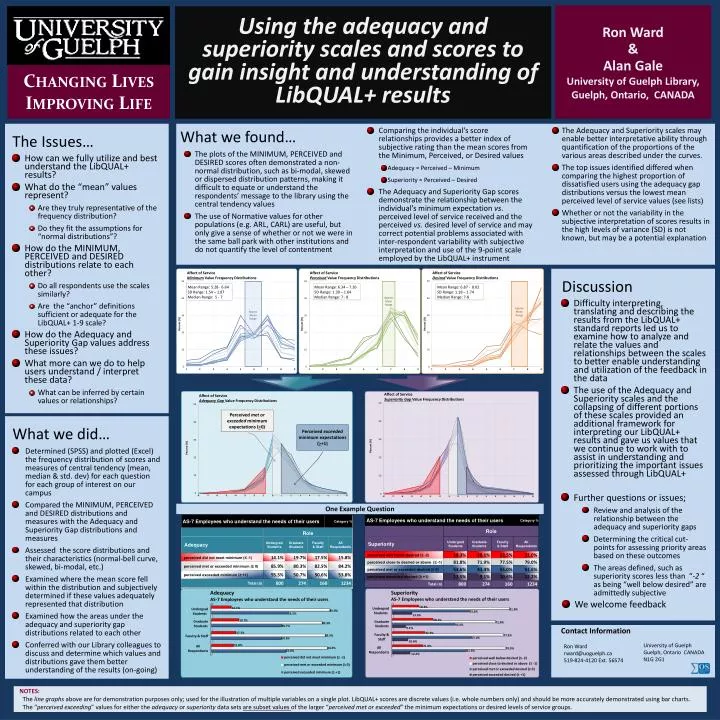
Ron Ward & Alan Gale University of Guelph Library, Guelph, Ontario, CANADA Changing Lives Improving Life • The Issues… • How can we fully utilize and best understand the LibQUAL+ results? • What do the “mean” values represent? • Are they truly representative of the frequency distribution? • Do they fit the assumptions for “normal distributions”? • How do the MINIMUM, PERCEIVED and DESIRED distributions relate to each other? • Do all respondents use the scales similarly? • Are the “anchor” definitions sufficient or adequate for the LibQUAL+ 1-9 scale? • How do the Adequacy and Superiority Gap values address these issues? • What more can we do to help users understand / interpret these data? • What can be inferred by certain values or relationships? • What we found… • The plots of the MINIMUM, PERCEIVED and DESIRED scores often demonstrated a non-normal distribution, such as bi-modal, skewed or dispersed distribution patterns, making it difficult to equate or understand the respondents’ message to the library using the central tendency values • The use of Normative values for other populations (e.g. ARL, CARL) are useful, but only give a sense of whether or not we were in the same ball park with other institutions and do not quantify the level of contentment • Comparing the individual’s score relationships provides a better index of subjective rating than the mean scores from the Minimum, Perceived, or Desired values • Adequacy = Perceived – Minimum • Superiority = Perceived – Desired • The Adequacy and Superiority Gap scores demonstrate the relationship between the individual’s minimum expectation vs. perceived level of service received and the perceived vs. desired level of service and may correct potential problems associated with inter-respondent variability with subjective interpretation and use of the 9-point scale employed by the LibQUAL+ instrument • The Adequacy and Superiority scales may enable better interpretative ability through quantification of the proportions of the various areas described under the curves. • The top issues identified differed when comparing the highest proportion of dissatisfied users using the adequacy gap distributions versus the lowest mean perceived level of service values (see lists) • Whether or not the variability in the subjective interpretation of scores results in the high levels of variance (SD) is not known, but may be a potential explanation Using the adequacy and superiority scales and scores to gain insight and understanding of LibQUAL+ results • Discussion • Difficulty interpreting, translating and describing the results from the LibQUAL+ standard reports led us to examine how to analyze and relate the values and relationships between the scales to better enable understanding and utilization of the feedback in the data • The use of the Adequacy and Superiority scales and the collapsing of different portions of these scales provided an additional framework for interpreting our LibQUAL+ results and gave us values that we continue to work with to assist in understanding and prioritizing the important issues assessed through LibQUAL+ • Further questions or issues; • Review and analysis of the relationship between the adequacy and superiority gaps • Determining the critical cut-points for assessing priority areas based on these outcomes • The areas defined, such as superiority scores less than “-2 “as being “well below desired” are admittedly subjective • We welcome feedback Approx Mean Range Approx Mean Range Approx Mean Range Mean Range: 5.28- 6.64 SD Range: 1.54 – 1.87 Median Range: 5 - 7 • What we did… • Determined (SPSS) and plotted (Excel) the frequency distribution of scores and measures of central tendency (mean, median & std. dev) for each question for each group of interest on our campus • Compared the MINIMUM, PERCEIVED and DESIRED distributions and measures with the Adequacy and Superiority Gap distributions and measures • Assessed the score distributions and their characteristics (normal-bell curve, skewed, bi-modal, etc.) • Examined where the mean score fell within the distribution and subjectively determined if these values adequately represented that distribution • Examined how the areas under the adequacy and superiority gap distributions related to each other • Conferred with our Library colleagues to discuss and determine which values and distributions gave them better understanding of the results (on-going) One Example Question Contact Information Ron Ward rward@uoguelph.ca 519-824-4120 Ext. 56574 University of Guelph Guelph, Ontario CANADA N1G 2G1 NOTES: The line graphs above are for demonstration purposes only; used for the illustration of multiple variables on a single plot. LibQUAL+ scores are discrete values (i.e. whole numbers only) and should be more accurately demonstrated using bar charts. The “perceived exceeding” values for either the adequacy or superiority data sets are subset values of the larger “perceived met or exceeded” the minimum expectations or desired levels of service groups.