Download
1 / 18
220 likes | 334 Vues
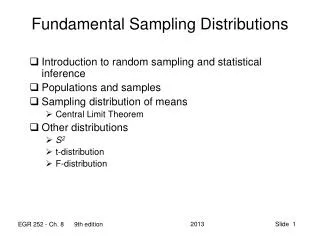
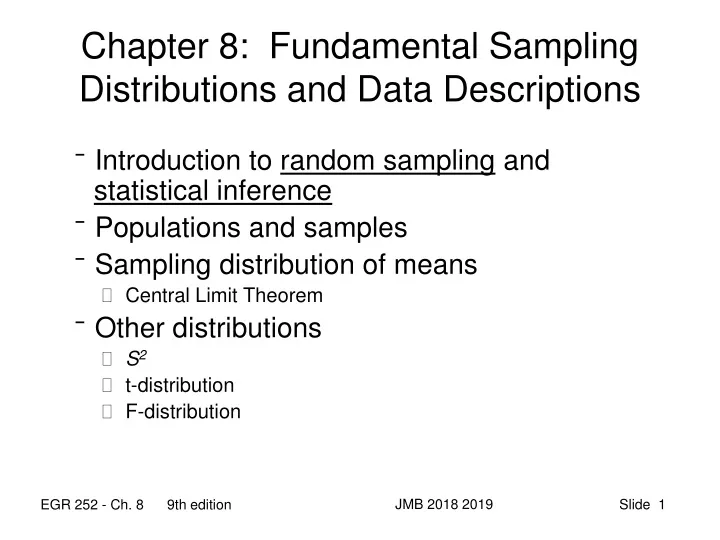
Introduction to random sampling and statistical inference Populations and samples Sampling distribution of means Central Limit Theorem Other distributions S 2 t-distribution F-distribution. Chapter 8: Fundamental Sampling Distributions and Data Descriptions. Populations and Samples.

E N D
Introduction to random sampling and statistical inference Populations and samples Sampling distribution of means Central Limit Theorem Other distributions S2 t-distribution F-distribution Chapter 8: Fundamental Sampling Distributions and Data Descriptions JMB 2018 2019
Populations and Samples • Population: “a group of individual persons, objects, or items from which samples are taken for statistical measurement” 1 • Sample: “a finite part of a statistical population whose properties are studied to gain information about the whole” 1 • Population – the totality of the observations with which we are concerned 2 • Sample – a subset of the population 2 1 (Merriam-Webster Online Dictionary, http://www.m-w.com/, October 5, 2004) 2 Walpole, Myers, Myers, and Ye (2007) Probability and Statistics for Engineers and Scientists JMB 2018 2019
Examples JMB 2018 2019
More Examples JMB 2018 2019
Basic Statistics (review) Sample Mean: A class project involved the formation of three 10-person teams (Team Q, Team R and Team S). At the end of the project, team members were asked to give themselves and each other a grade on their contribution to the group. A random sample from two of the teams yielded the following results: = 87.5 = 85.0 JMB 2018 2019
Basic Statistics (review) • Sample variance equation: • For our example: • Calculate the sample standard deviation (s) for each sample. • SQteam = 7.59386 and SRteam = 7.25718 JMB 2018 2019
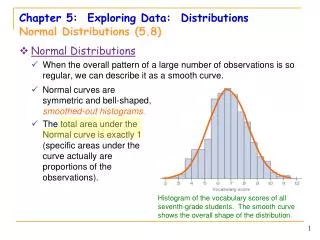
Sampling Distributions • If we conduct the same experiment several times with the same sample size, the probability distribution of the resulting statistic is called a sampling distribution • Sampling distribution of the mean: if n observations are taken from a normal population with mean μ and variance σ2, then: JMB 2018 2019
Central Limit Theorem • Given: X :the mean of a random sample of size n taken from a population with mean μ and finite variance σ2, the limiting form of the distribution of is the standard normal distribution n(z;0,1) Note that this equation for Z applies when we have sample data. Compare to the Z equation for the population (Ch6). JMB 2018 2019
Central Limit Theorem-Distribution of X • If the population is known to be normal, the sampling distribution of X will follow a normal distribution. • Even when the distribution of the population is not normal, the sampling distribution of X is normal when n is large. • NOTE: when n is not large, we cannot assume the distribution of X is normal. JMB 2018 2019
Sampling Distribution of the Difference Between Two Averages • Given: • Two samples of size n1 and n2 are taken from two populations with means μ1 and μ2 and variances σ12 and σ22 • Then, JMB 2018 2019
Sampling Distribution of S2 • Given: • If S2 is the variance of of a random sample of size n taken from a population with mean μ and finite variance σ2, • Then, has a χ2 distribution with ν = n - 1 JMB 2018 2019
Chi-squared (χ2) Distribution • χα2represents the χ2value above which we find an area of α, that is, for which P(χ2> χα2) = α. α JMB 2018 2019
Example • Look at example 8.7, pg. 245: A manufacturer of car batteries guarantees that his batteries will last, on average, 3 years with a standard deviation of 1 year. A sample of five of the batteries yielded a sample variance of 0.815. Does the manufacturer have reason to suspect the standard deviation is no longer 1 year? μ = 3 σ = 1 n = 5 Degrees of freedom (v) = n-1 s2 = 0.815 If the χ2 value fits within an interval that covers 95% of the χ2 values with 4 degrees of freedom, then the estimate for σ is reasonable. See Table A.5, (pp. 739-740) For alpha = 0.025, Χ2 =11.143 The Χ2 value for alpha = 0.975 is 0.484. 0.484 3.26 11.143 JMB 2018 2019
Your turn … • If a sample of size 7 is taken from a normal population (i.e., n = 7), what value of χ2 corresponds to P(χ2 < χα2) = 0.95? (Hint: first determine α.) 95% 12.592 JMB 2018 2019
t- Distribution • Recall, by Central Limit Theorem: is n(z; 0,1) • Assumption: σ known ( Z ) (Generally, if an engineer is concerned with a familiar process or system, this is reasonable, but …) JMB 2018 2019
What if we don’t know σ? (sigma unknown) • New statistic: Where, and follows a t-distribution with ν = n – 1 degrees of freedom. JMB 2018 2019
Characteristics of the t-Distribution • Look at Figure 8.8, pg. 248 • Note: • Shape: _________________________ • Effect of ν: __________________________ • See table A.4, pp. 737-738 Note that the table yields the right tail of the distribution. JMB 2018 2019
F-Distribution • Given: • S12 and S22, the variances of independent random samples of size n1 and n2taken from normal populations with variances σ12 and σ22, respectively, • Then, has an F-distribution with ν1 = n1 - 1 and ν2 = n2 – 1 degrees of freedom. (See table A.6, pp. 741-744) JMB 2018 2019