Download
1 / 27
270 likes | 403 Vues
Online Monitoring and Reconstruction. Linda R. Coney 4 June, 2009. Outline. Introduction Data Structure Unpacking DATE data Online Monitoring Online Reconstruction Conclusions. MICE Online. So far: DAQ front end Trigger Event Building Controls and Monitoring

E N D
Online Monitoring and Reconstruction Linda R. Coney 4 June, 2009 Linda R. Coney – 24th April 2009
Outline • Introduction • Data Structure • Unpacking DATE data • Online Monitoring • Online Reconstruction • Conclusions Linda R. Coney – 4 June 2009
MICE Online • So far: • DAQ front end • Trigger • Event Building • Controls and Monitoring • Given that we are successfully running the experiment and creating data • How do we know the equipment is working well? • How do we check the data quality? • Two levels of real-time data quality checks • Online Monitoring • Look at raw data for each board in the DAQ • No translation into physical quantities • Online Reconstruction • Initial look at analysis variables • Next: see Henry’s talk about the Data Flow… Linda R. Coney – 4 June 2009
DAQ Terminology LDC – Local Data Collector GDC – Global Data Collector Equipment – module in DAQ crate DATE – The DAQ Software Linda R. Coney – 4 June 2009
Data Format • DAQ Events: • SuperEvent • contains SubEvents • come from single crate (ie. come from LDC) • Header for Super/Sub events is the same • Event Fragment is data from single board in crate (equipment) • Fragments have different information for different board types • Two types of Events • CALIBRATION • Always 1 particle event • PHYSICS • Can have multiple particle events • Should have 2 crates • Data volume dominated by fADCs • Particle event info is board specific Linda R. Coney – 4 June 2009
Raw Data Format … DAQ Event N GDC Header … LDC J Header … DAQ Event N Payload … Equipment K Header LDC J Payload … … Equipment K Payload Particle Event M Data: Board Manufacturer Format LDC J+1 Header DAQ Event N+1 GDC Header Particle Event M+1 Data: Board Manufacturer Format Equipment K+1 Header LDC J+1 Payload … DAQ Event N+1 Payload … Equipment K+1 Payload … … … … Run File (Super-) Event (Sub-) Event Event Fragment Linda R. Coney – 4 June 2009
DATE Event Header Format Event Header • This structure comes from DATE Linda R. Coney – 4 June 2009
DATE Equipment Header Format Conventional Table of Equipment Type: Type Equipment 0 Random Generator 100 V2718 101 Trigger Receiver 102 TDC V1290 104 VLSB 110 Trailer 111 Scalar V830 120 fADC V1724 Equipment Header Linda R. Coney – 4 June 2009
Particle Data Format Example - CAEN V1290 TDC T = 1 for Trailing Edge Measurement Data Data Type TDC V1290 Linda R. Coney – 4 June 2009 V. Verguilov
Data Unpacking Classes Linda R. Coney – 4 June 2009
Data Unpacking Classes MDdataContainer - base class for all MDEvent – handles sub and super events MDeventFragment - container for the particle events, data from single board MDpartEventXXX - classes manipulating the data (at event level) from each equipment using corresponding MDdataWordXXX class MDpartEventV1724: GetPattern, GetChannelMask, GetTriggerTimeTag, GetSampleData (fADC) MDpartEventV1290: GetHitMeasurement, GetHitType, GetHitChannel, GetNHits (TDC) MDequipMap- Class using a hash to determine which object (MDpartEventXXX) can decode specific event, based on the Equipment Id of the event MDdataWord - base class for word-level classes (SetDataWord( void * d)) MDdataWordXXX - classes implementing the data format (at word-level) of each equipment MDdataWordV1724: GetSample MDdataWordV1290: GetMeasurement, GetChannel, GetTDC, GetError, GetWordCount, GetBunchID, GetEventID MDdateFile - IO routines for the DATE raw data file MDargumentHandler – class for manipulating command-line input Linda R. Coney – 4 June 2009
Unpacking Flow Chart Linda R. Coney – 4 June 2009
Online Monitoring Linda R. Coney – 4 June 2009
Online Monitoring • Run unpacker on DATE data • Fill plots for each type of board • No geography information • No reconstruction • Boards have ID# but no information on what channel it is • Fill online monitoring histograms in real time while taking data • Use to debug operations • Provides data quality check • Provide graphical interface to display plots • There are 3 overall types of plots because there are 3 types of board • FADCs • Scalar • TDCs Linda R. Coney – 4 June 2009
Scalar in DAQ Part. Trg Req. Cumulative, average and Last Spill Available TOF0 GVA2 CKOVA/B GVA1 Part. Trigger Clock 1MHz GVA3 Linda R. Coney – 4 June 2009 Scalars count hits inside the DAQ Spill Gate
Online Monitoring Histograms • Example of monitoring plots from data run in November08 • Preset histograms • TOF position info, Scalars Linda R. Coney – 4 June 2009
Online Monitoring Actions • DAQ DATE Readout is finished • Create framework for decoding data • Implement unpacking for TOF, CKOV, KL • Test data readout, unpacking, and monitoring with real-time data • Include unpacking with G4MICE • Create online monitoring plots for TOF, CKOV • Upgrade FADC firmware (7/09) • Will decrease size of data • Modify FADC monitoring plots (7/09) • Implement unpacking for Tracker (08/09) • Create online monitoring plots for KL,Tracker, EMR (9/09, 2010) • Implement unpacking for EMR (2009) Linda R. Coney – 4 June 2009
Online Reconstruction Linda R. Coney – 4 June 2009
Online Reconstruction • G4MICE uses the unpacker to look at data from DATE • It then converts the raw data into information with physical meaning • Goal: • Provide a fixed set of histograms to be filled in real time during data taking • These histograms will contain quantities that can give information about the physics happening – first look at analysis quantities • Provides another data quality check • Are we taking the data we think we are? • Are the detectors & beam behaving as planned? • Provide graphical interface to display plots • Not meant to be final results • Collaboration chooses list of useful histograms Linda R. Coney – 4 June 2009
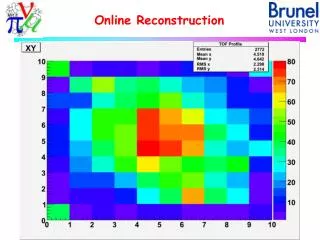
Online Reconstruction Histograms • TOF • Reconstructed time-of-flight • Distribution in x, y across TOF0, TOF1, TOF2 • 2D x vs y g gives shape of beam • CKOV • Light yield • KL • EMR • Tracker(s) • Muon px, py, pz, pT, p at the 2 tracker reference planes • x,x’, y,y’ • 1D, 2D plots of position at 2 tracker reference planes • Light yield distributions for each station • PID determination • Beam emittance, amplitude Linda R. Coney – 4 June 2009
Online Reconstruction Histograms • What is needed to produce these plots? • Online Reconstruction farm • G4MICE installed on farm • TOF reconstruction • CKOV reconstruction • Tracker reconstruction • KL reconstruction • Unpacking code for each detector • Check that G4MICE uses unpacker in a same way that Online Monitoring uses unpacker Linda R. Coney – 4 June 2009
Current Status of Reconstruction • TOF Reconstruction and calibration well underway • CKOV reco same • Tracker reconstruction works Linda R. Coney – 4 June 2009
Online Reconstruction Farm • Installed two farm computers in MICE control room March 09 • Total of three quad-core processors • G4MICE installed on both • Tests run • Reconstructed tracker cosmic ray test data • 114 events/second • Ran simulation, digitization, and reconstruction of Step VI • Simulation: ~262 events/second • Simulation + Digi: ~236 events/second • Reconstruction: ~1920 events/second Linda R. Coney – 4 June 2009
Online Reconstruction Histograms • What is needed to produce these plots? • Online Reconstruction farm • G4MICE installed on farm • TOF reconstruction • CKOV reco • Tracker reco • KL reco • Unpacking code for each detector • TOF, CKOV, GVA, KL • Trackers, EMR (08/09, late 2009) • Check that G4MICE uses unpacker in same way that Online Monitoring uses unpacker • Can produce online monitoring plots with G4MICE • Testing under way to compare to standard Online Monitoring plots (6/09) Linda R. Coney – 4 June 2009
Conclusions • We are now able to • Read out and decode DATE DAQ from MICE beam data • Monitor Step I raw data quality and detector performance with Online Monitoring • Reconstruct TOF, CKOV, Tracker data • We will soon • Implement online reconstruction for Step I • Include tracker in online monitoring for Step II • We will eventually • Include necessary information for further steps • Routinely have shifters monitoring detectors and MICE physics in MLCR Linda R. Coney – 4 June 2009
The MICE Schedule • Experiment designed to grow with each step providing important information