Download
1 / 41
410 likes | 413 Vues
This study examines the waste generation and management practices in North Carolina, including landfilling, recycling, waste-to-energy, composting, and anaerobic digestion. It provides an overview of the study methodology, national and state-specific results, and the composition of various waste management facilities.

E N D
North Carolina MSW Management: Tonnage and Trends Debra L. Kantner Bryan Staley, PhD PE Data & Policy Program Manager President and CEO
EREF Programs • Research Grants • Scholarships • Education • Data & Policy Analysis (Internal Research)
Talk Overview Waste Generation and Management in the U.S. • Study Premise & Methodology • National Results Facilities and Tonnage N.C. Waste Management by End Point • Landfilling • Recycling • Waste-to-Energy (incineration w/ energy recovery) • Composting • Anaerobic Digestion Summary
Existing Waste Data • U.S. EPA Solid Waste Facts & Figures • materials flow analysis based on production, import/export • makes various assumptions (e.g. time before discard) • minimal reliance on actual waste management facility data • Biocycle State of Garbage Report • last published in 2010 (using 2008 data) but discontinued • 2011 data available in Master’s thesis • primarily based on state agency data • recycling & composting data held by states is incomplete
Study Objectives Goal: Create a national inventory of U.S. MSW generation • Evaluate relative fractions of materials going to: • Landfills • Recycling Facilities • Waste-to-energy Facilities • Composting Operations • Anaerobic Digestion • Understand materials flow dynamics related to: • Recycling • Composting • Anaerobic digestion
Methodology Overview • Facility based, ‘bottom up’ approach • Facility lists generated first • Key data (e.g. tonnage) acquired via: • State agencies and other databases where data deemed reliable (e.g. landfills) • Direct contact with facility • Data adjusted to account for potential sources of error • Facilities only handling non-MSW materials • Non-MSW materials/organics (e.g. agricultural biomass) • Front-of-gate vs. processed tonnage
Waste Management National Picture
Number of Facilities 3,913 3,494 1,540 799 MRFs 81 • ~43% are recycling facilities, but 9% are MRFs • 81% of waste facilities do either composting or recycling
Facility Ownership • Majority of MSW facilities are privately owned • Majority of MSW tonnage is managed at privately-owned facilities
U.S. Waste Management Tonnages • 347 million tons of MSW managed in 2013 • 6.0 lbs/person-day • Majority is landfilled • Collectively, about 27% is recycled or composted • 73 million tons recycled • 1.2 lbs/person-day
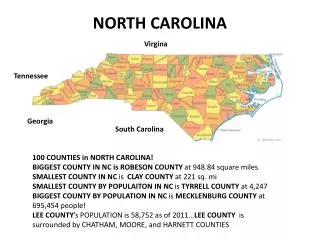
Facilities Managing MSW • 186 Active MSW Facilities were identified in N.C. • Most facilities (79%) associated with material recovery • Recycling (58%) and Composting (21%) • 16% of recycling facilities are MRFs
N.C. Waste Management Tonnages • 9.7 million tons of MSW managed in 2013 • 5.4 lbs/person-day • Majority is landfilled • Collectively, about 24% is recycled or composted • 2.1 million tons recycled • 0.8 lbs/person-day
Import and Export • Import and Export of MSW across NC state line • Net exporter of MSW • 5.2% of collected MSW was exported • In 2013, 4 states exported more than 20% of MSW
Landfilling in N.C. • The majority of MSW managed in N.C. is via landfill (76%), managed at 39 MSW landfills • By # facilities: 85% public • By tonnage: 58% private • The 5 largest landfills in N.C. managed 51% of the landfilled MSW
Landfill Gas Management Tonnage Basis • Landfill gas collection and beneficial use was examined: • On tonnage basis, 81% of N.C. waste is managed under gas capture
Recycling in N.C. • 21% of MSW managed in N.C. was recycled • Southeast Region: 18% • State rates ranged from 4% to 42%
Mass Balance of Recyclables North Carolina MRF Owner/Large Hauler (most Residential) Commercial Non-MRF 69% 31% End User (e.g. paper mill) MRF
MRFs By State • High MRF density relates to access to materials end user (e.g. ports)
Recycling Facility Residual Generation • Current rate (EREF, 2013) = 12% • Range: 3% to 51% • Previous rate (Berenyi, 2007) = 7% • Range: 3% to 11% (source separated) (single stream) • Residual rate nearly doubled in last 7 yrs • Variability appears to be much higher • Likely to due increase in single stream, acceptance of more materials, etc.
Waste-to-Energy (Incineration w/ energy recovery)
WTE Incineration By Region Regional Results U.S. MSW Incineration (2013): 30.7 million tons • Primarily in the Northeast • 58% of facilities in the Northeast • 65% of tonnage
Composting in N.C. • 39 MSW composting facilities identified, managing 3% of MSW in 2013 • By # facilities: 72% private • Average MSW content to N.C. composting operations is 65% • National average to MSW composting facilities is 88% MSW
Feedstock Composition • MSW composition primarily grass clippings/green waste
Anaerobic Digestion As part of the study, we identified: • 180 facilities accept MSW organics • 3 primary classes of facilities
Feedstock Composition MSW Organics Managed (2013): 784,037 tons Average Throughput (tons/month-facility): • 1,639 stand-alone • 237 WWTP • 160 on-farm
Feedstock Composition • Facilities also accept non-MSW • Average MSW content to stand-alone operations is 83% On-Farm: 23% WWTP: 11% • MSW composition primarily food and processing waste
Key Take Aways • Landfilling continues to be the primary way MSW is managed • Recycling infrastructure includes variety of facilities in addition to traditional MRFs • Organics management is a focus: • Composting increasing, primarily managing yard waste • Anaerobic Digestion growing, handle food waste
Acknowledgements EREF Interns Kristopher Blanco Ryan Duckett Patrick Greenhalgh Mackenzie Hart Brianna Holland Ashley Kabat Jessica Myers James Wallace Alma Beciragic Stephen Reece Megan Rodgers Heather Troutman
Thank you! Debra Kantner dkantner@erefdn.org www.erefdn.org From the EREF Data & Policy Report: MSW Management in the U.S.: 2010 & 2013 Proceeds are used to provide college internships!
Number of Facilities EREF & Previous Estimates * Sources: ILSR State of Composting, Waste Business Journal, and Berenyi MRF database. • EREF facilities are verified active operations that process MSW components in some form.
Average Processing Capacity per Facility 144 383 71 at MRFs 18 6 • Recycling includes MRFs and Non-MRFs, but MRFs nearly 3 times higher than the average
EREF & US EPA Difference by End Point • A large difference for landfill tonnage has been observed in other studies: • Biocycle State of Garbage reports: state-provided statistics • Powell et. al. (2015): facility data from GHG reporting tool
MSW to Landfills Comparison of Studies • Independent lines of research suggest material flow methodology used by the EPA underestimates MSW sent to landfill • EREF study one of the first to: • Use comprehensive facility-data to correct for non-MSW materials • Contact landfills without reporting data to fill in data gaps 1Shin, Dolly (2014). Generation and Disposition of Municipal Solid Waste (MSW) in the United States- A National Survey. MS Thesis, Columbia University. 2Powell, J.T., Townsend, T.G., and Zimmerman, J.B. (2015) “Estimates of solid waste disposal rates and reduction targets for landfill gas emissions” Nature Climate Change