Download
1 / 1
10 likes | 103 Vues
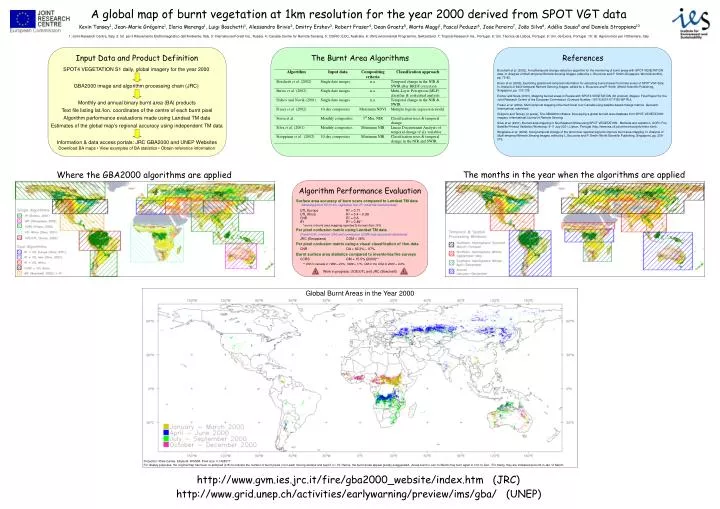
A global map of burnt vegetation at 1km resolution for the year 2000 derived from SPOT VGT data.

E N D
A global map of burnt vegetation at 1km resolution for the year 2000 derived from SPOT VGT data Kevin Tansey1, Jean-Marie Grégoire1, Ilaria Marengo1, Luigi Boschetti1, Alessandro Brivio2, Dmitry Ershov3, Robert Fraser4, Dean Graetz5, Marta Maggi1, Pascal Peduzzi6, Jose Pereira7, João Silva8, Adélia Sousa9 and Daniela Stroppiana10 1: Joint Research Centre, Italy. 2: Ist. per il Rilevamento Elettromagnetico dell’Ambiente, Italy. 3: International Forest Ins., Russia. 4: Canada Centre for Remote Sensing. 5: CSIRO: EOC, Australia. 6: UN Environmental Programme, Switzerland. 7: Tropical Research Ins., Portugal. 8: Uni. Técnica de Lisboa, Portugal. 9: Uni. de Évora, Portugal. 10: Ist. Agronomico per l’Oltremare, Italy Input Data and Product Definition The Burnt Area Algorithms References SPOT4 VEGETATION S1 daily, global imagery for the year 2000 Boschetti et al. (2002), A multitemporal change-detection algorithm for the monitoring of burnt areas with SPOT-VEGETATION data. In Analysis of Multi-temporal Remote Sensing Images, edited by L. Bruzzone and P. Smith (Singapore: World Scientific), pp. 75-82. Brivio et al. (2002), Exploiting spatial and temporal information for extracting burned areas from time series of SPOT VGT data. In Analysis of Multi-temporal Remote Sensing Images, edited by L. Bruzzone and P. Smith (World Scientific Publishing, Singapore), pp. 133-139. GBA2000 image and algorithm processing chain (JRC) Ershov and Novik (2001), Mapping burned areas in Russia with SPOT4 VEGETATION (S1 product) imagery. Final Report for the Joint Research Centre of the European Commission (Contract Number: 18176-2001-07-F1EI ISP RU). Monthly and annual binary burnt area (BA) products Fraser et al. (2002), Multi-temporal mapping of burned forest over Canada using satellite-based change metrics. Geocarto International, submitted. Text file listing lat./lon. coordinates of the centre of each burnt pixel Grégoire and Tansey (in press), The GBA2000 initiative: Developing a global burned area database from SPOT-VEGETATION imagery. International Journal of Remote Sensing. Algorithm performance evaluations made using Landsat TM data Silva et al. (2001), Burned area mapping in Southeastern Africa using SPOT VEGETATION: Methods and validation. GOFC Fire Satellite Product Validation Workshop, 9-11 July 2001, Lisbon, Portugal (http://www.isa.utl.pt/cef/eventos/gofc/index.html). Estimates of the global map’s regional accuracy using independent TM data Stoppiana et al. (2002), Using temporal change of the land cover spectral signal to improve burnt area mapping. In Analysis of Multi-temporal Remote Sensing Images, edited by L. Bruzzone and P. Smith (World Scientific Publishing, Singapore), pp. 209-216. Information & data access portals: JRC GBA2000 and UNEP Websites Download BA maps • View examples of BA statistics • Obtain reference information The months in the year when the algorithms are applied Where the GBA2000 algorithms are applied Algorithm Performance Evaluation Surface area accuracy of burn scars compared to Landsat TM data Sampling grid of 15x15 km, regression line, R2, small low resolution bias UTL Europe R2 = 0.71 UTL Africa R2 = 0.4 – 0.99 CNR R2 = 0.6 IFI R2 = 0.89* * errors in burnt area mapping reported to be less than 15% Per pixel confusion matrix using Landsat TM data Overall (OA), omission (OM) and commission (COM) map accuracies determined JRC (Stroppiana) COM = 36% Per pixel confusion matrix using a visual classification of 1km data CNR OA = 82.3% – 87% Burnt surface area statistics compared to inventories/fire surveys CCRS OM = 15.5% (2000)** ** OM in Canada in 1998 = 23%, 1999 = 11%. OM in the USA in 2000 = 6.6% Work in progress: UOE/UTL and JRC (Boschetti) Global Burnt Areas in the Year 2000 Projection: Plate Carrée. Ellipsoid: WGS84. Pixel size: 0.1428571. For display purposes, the original map has been re-sampled (x16) to indicate the number of burnt pixels (n) in each moving window and kept if n 16. Hence, the burnt areas appear greatly exaggerated. Areas burnt in Jan. to March may burn again in Oct. to Dec. For clarity, they are indicated as burnt in Jan. to March. http://www.gvm.ies.jrc.it/fire/gba2000_website/index.htm (JRC) http://www.grid.unep.ch/activities/earlywarning/preview/ims/gba/ (UNEP)