Download
1 / 14
140 likes | 262 Vues
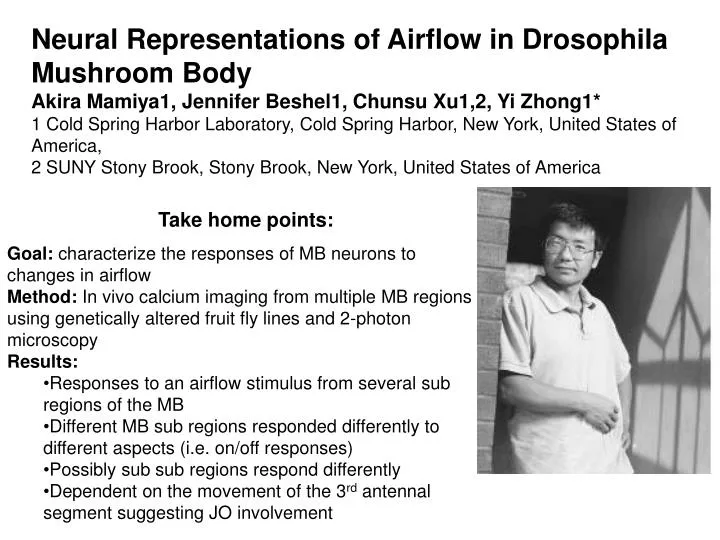
Neural Representations of Airflow in Drosophila Mushroom Body Akira Mamiya1, Jennifer Beshel1, Chunsu Xu1,2, Yi Zhong1* 1 Cold Spring Harbor Laboratory, Cold Spring Harbor, New York, United States of America, 2 SUNY Stony Brook, Stony Brook, New York, United States of America.

E N D
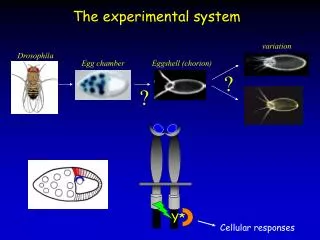
Neural Representations of Airflow in Drosophila Mushroom Body Akira Mamiya1, Jennifer Beshel1, Chunsu Xu1,2, Yi Zhong1* 1 Cold Spring Harbor Laboratory, Cold Spring Harbor, New York, United States of America, 2 SUNY Stony Brook, Stony Brook, New York, United States of America • Take home points: • Goal: characterize the responses of MB neurons to changes in airflow • Method: In vivo calcium imaging from multiple MB regions using genetically altered fruit fly lines and 2-photon microscopy • Results: • Responses to an airflow stimulus from several sub regions of the MB • Different MB sub regions responded differently to different aspects (i.e. on/off responses) • Possibly sub sub regions respond differently • Dependent on the movement of the 3rd antennal segment suggesting JO involvement
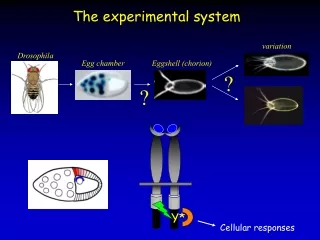
Method • Get TG fruitflies that have a calcium sensor • UAS-G-CaMP1.3 • UAS-G-CaMP1.6 • Cross with GAL4 fruit fly lines that will allow targeted expression of the calcium sensor in specific cells • OK107-Gal4: non-selective MB general • c739-Gal4: A/B lobe neurons • g0050-Gal4 and c305a-Gal4: A’/B’ lobe neurons • Fix fruit fly to an imaging stage • Puff air and measure fluorescence: • 3s stims • 100 ml/min (1.2m/s ) • 3 min ITI • Analyses based on ΔF/Fo which is a measure of changes in Ca++ induced florescence on a pixel by pixel basis
Figure 1 Experimental recording sites and raw ΔF/Fo
Temporal dynamics of responses • 1 s data integration window (3 frames) • Averaged results Figure 2
Figure 2 Mean On, off responses as a function of lobes The total area involved in response
Figure 3 Different Gal4 lines show that A,B and A’B’ have different response profiles • OK107-Gal4: non-selective MB general • c739-Gal4: A/B lobe neurons • g0050-Gal4 and c305a-Gal4: A’/B’ lobe neurons
Figure 4 • Responses generally depend on movement of the 3rd antennal segment • When glued Ca++ responses are greatly diminished
Figure 4 • Responses generally depend on movement of the 3rd antennal segment • When glued Ca++ responses are greatly diminished By comparison with Figure 2 most areas have dropped
Figure 5 Sub region specific responses to “on” and “off” phases of the stimulus
Figure 5 Watershed Segmentation highlights sub region specific responses
Figure 6 “On Off Selectivity Index” (OSI) highlights watershed “patches” within lobes as “on” or “off” response selective (or neither)
Figure 7 Off responding patches are spatially organized and stereotypic across individuals
Figure 8 Using two Gal4 lines they show that the off and on responses are different subsets of cells
Figure 8 g0050-Gal4 cells are significantly more off responsive than c305a-Gal4