Download
1 / 54
540 likes | 551 Vues
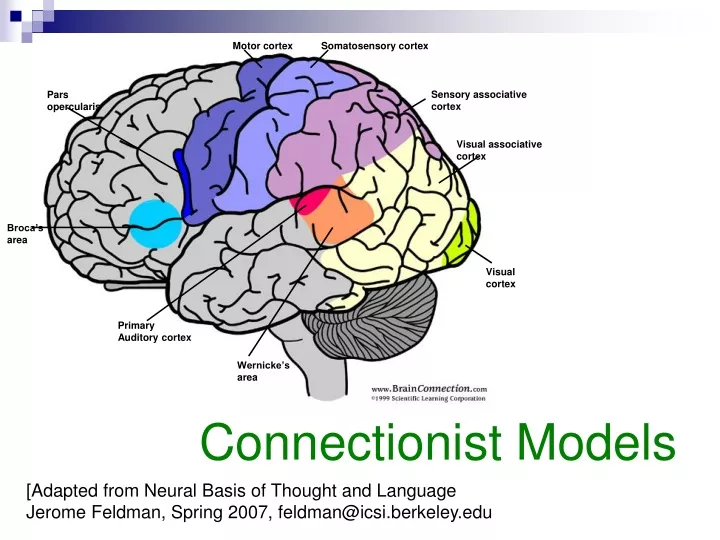
Motor cortex. Somatosensory cortex. Sensory associative cortex. Pars opercularis. Visual associative cortex. Broca’s area. Visual cortex. Primary Auditory cortex. Wernicke’s area. Connectionist Models. [Adapted from Neural Basis of Thought and Language

E N D
Motor cortex Somatosensory cortex Sensory associative cortex Pars opercularis Visual associative cortex Broca’s area Visual cortex Primary Auditory cortex Wernicke’s area Connectionist Models [Adapted from Neural Basis of Thought and Language Jerome Feldman, Spring 2007, feldman@icsi.berkeley.edu
Neural networks abstract from the details of real neurons • Conductivity delays are neglected • An output signal is either discrete (e.g., 0 or 1) or it is a real-valued number (e.g., between 0 and 1) • Net input is calculated as the weighted sum of the input signals • Net input is transformed into an output signal via a simple function (e.g., a threshold function)
yj wij yi xi f ti : target xi = ∑j wij yj yi = f(xi – qi) The McCullough-Pitts Neuron yj: output from unit j Wij: weight on connection from j to i xi: weighted sum of input to unit i Threshold
a = x1w1+x2w2+x3w3... +xnwn a= 1*x1 + 0.5*x2 +0.1*x3 x1 =0, x2 = 1, x3 =0 Net(input) = f = 0.5 Threshold bias = 1 Net(input) – threshold bias< 0 Output = 0 A Simple Example .
Simple Neuron Model 1 1 1 1
Simple Neuron Model 1 1 1 1 1
Simple Neuron Model 0 1 1 1
Simple Neuron Model 0 1 0 1 1
BIAS UNIT With X0 = 1 Different Activation Functions • Threshold Activation Function (step) • Piecewise Linear Activation Function • Sigmoid Activation Funtion • Gaussian Activation Function • Radial Basis Function
The Sigmoid Function y=a x=neti
The Sigmoid Function Output=1 y=a Output=0 x=neti
The Sigmoid Function Output=1 Sensitivity to input y=a Output=0 x=neti
Changing the exponent k K >1 K < 1
Stochastic units • Replace the binary threshold units by binary stochastic units that make biased random decisions. • The “temperature” controls the amount of noise temperature
Types of Neuron parameters • The form of the input function - e.g. linear, sigma-pi (multiplicative), cubic. • The activation-output relation - linear, hard-limiter, or sigmoidal. • The nature of the signals used to communicate between nodes - analog or boolean. • The dynamics of the node - deterministic or stochastic.
Computing various functions • McCollough-Pitts Neurons can compute logical functions. • AND, NOT, OR
i1 w01 w02 i2 y0 b=1 w0b x0 f Computing other functions: the OR function • Assume a binary threshold activation function. • What should you set w01, w02 and w0b to be so that you can get the right answers for y0?
i2 i1 Many answers would work y = f (w01i1 + w02i2 + w0bb) recall the threshold function the separation happens when w01i1 + w02i2 + w0bb = 0 move things around and you get i2 = - (w01/w02)i1 - (w0bb/w02)
Decision Hyperplane • The two classes are therefore separated by the `decision' line which is defined by putting the activation equal to the threshold. • It turns out that it is possible to generalise this result to TLUs with n inputs. • In 3-D the two classes are separated by a decision-plane. • In n-D this becomes a decision-hyperplane.
Linearly separable patterns PERCEPTRON is an architecture which can solve this type of decision boundary problem. An "on" response in the output node represents one class, and an "off" response represents the other. Linearly Separable Patterns
The Perceptron Input Pattern
The Perceptron Input Pattern Output Classification
Pattern Space • The space in which the inputs reside is referred to as the pattern space. • Each pattern determines a point in the space by using its component values as space-coordinates. • In general, for n-inputs, the pattern space will be n-dimensional.
The Decision planes From: S. Harris Computer Cartoons http://www.sciencecartoonsplus.com/galcomp2.htm
A B C Triangle nodes and McCullough-Pitts Neurons? A B C
Representing concepts using triangle nodes triangle nodes: when two of the neurons fire, the third also fires
Basic Ideas • Parallel activation streams. • Top down and bottom up activation combine to determine the best matching structure. • Triangle nodes bind features of objects to values • Mutual inhibition and competition between structures • Mental connections are active neural connections
Bottom-up vs. Top-down Processes • Bottom-up: When processing is driven by the stimulus • Top-down: When knowledge and context are used to assist and drive processing • Interaction: The stimulus is the basis of processing but almost immediately top-down processes are initiated
Stroop Effect • Interference between form and meaning
Name the words BookCarTableBoxTrashManBed CornSitPaperCoin Glass HouseJar KeyRugCatDoll Letter BabyTomato CheckPhone Soda DishLampWoman
Name the print color of the words BlueGreenRed YellowOrangeBlackRed PurpleGreenRedBlueYellowBlackRed GreenWhiteBlueYellow Red BlackBlue WhiteRed Yellow GreenBlackPurple
Connectionist ModelMcClelland & Rumelhart (1981) • Knowledge is distributed and processing occurs in parallel, with both bottom-up and top-down influences • This model can explain the Word-Superiority Effect because it canaccount for context effects
TRACE predictions Do rhymes compete? • Cohort (Marlsen-Wilson): • onset similarity is primary because of the incremental nature of speech • Cat activates cap, cast, cattle, camera, etc. • NAM (Neighborhood Activation Model): • global similarity is primary • Cat activates bat, rat, cot, cast, etc. • TRACE (McClelland & Elman): • global similarity constrained by incremental nature of speech
Do rhymes compete? • Temporal Sequence Learning in LTM • global similarity constrained by incremental nature of speech
Semantic Features FOG DOG CAT RAT MAT f r d k m ae o t g Onsets Vowels Codas A 2-step Lexical Model
Linking memory and tasks From: S. Harris Computer Cartoons http://www.sciencecartoonsplus.com/galcomp2.htm
What happens if you want to represent a group? How many persons can you represent with n bits? 2^n What happens if one neuron dies? How many persons can you represent with n bits? n Distributed vs Local Representation