Download
1 / 6
60 likes | 122 Vues
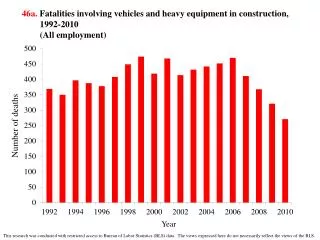
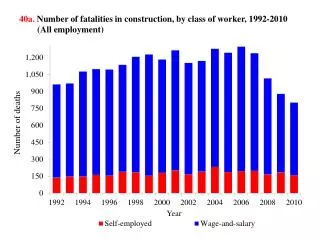
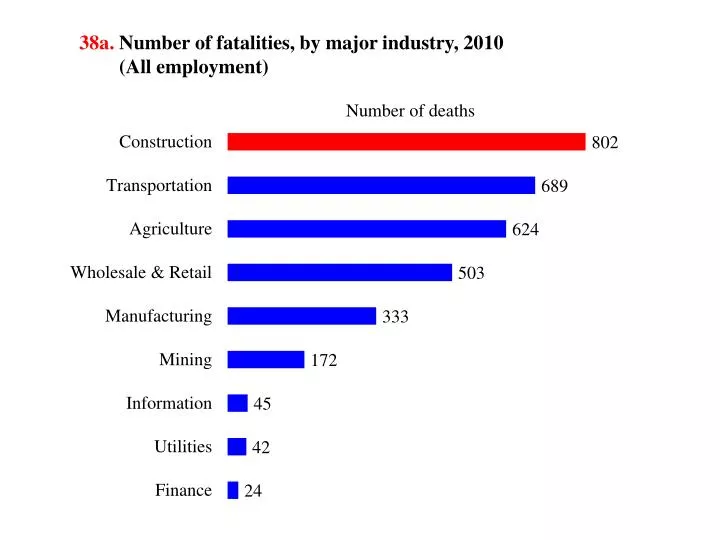
38a. Number of fatalities, by major industry, 2010 (All employment) . 38b. Number of fatalities in construction, 1992-2010 (All employment). 1,278. 1,297. 1,243. 1,239. 1,207. 1,183. 1,171. 1,153. 1,095. 1,077. 1,016. 963. 879 .

E N D
38a. Number of fatalities, by major industry, 2010 (All employment)
38b. Number of fatalities in construction, 1992-2010(All employment) 1,278 1,297 1,243 1,239 1,207 1,183 1,171 1,153 1,095 1,077 1,016 963 879
38c. Rate of fatalities, selected industries, 1992-2010 (All employment)
38d. Number of nonfatal injuries resulting in days away from work in construction, 1992-2010(Private wage-and-salary workers) OSHA revised requirements 218.7 209.6 194.5 182.3 178.3 163.6 155.4 157.1 153.2 153.2 135.4 120.2 92.5
38e. Rate of nonfatal injuries resulting in days away from work, by major industry, 2010(Private wage-and-salary workers)
38f. Rate of nonfatal injuries resulting in days away from work, selected industries, 1992-2010(Private wage-and-salary workers)